This Captured Lightning sculpture was created by injecting trillions of
electrons into a block of
clear acrylic using a 5 million
volt particle accelerator. Electrons were injected into one side, the
specimen was rotated 180 degrees, and additional electrons
were injected through the opposite side. This created two
intensely-charged layers of excess electrons inside the specimen, each
located about
one-half inch below the
surface. The charge layer on the right side was then manually
discharged. The escaping electrons created a brilliant flash of
miniature "lightning" that propagated upward through the nearest
charge
layer. Additional discharges then grew from the right layer
towards the left layer, forming a complex, beautifully
interconnected 3D structure. The entire discharge took place in less
than 100 billionths of a second! The resulting sculpture above is
illuminated
from below
by blue light emitting diodes (LED's). Each of our Captured Lightning
sculptures contains an incredibly detailed fractal-like discharge
pattern.
Unlike laser art, every one of our sculptures is a one-of-a-kind
treasure. As they
branch, the discharge channels become increasingly thinner. The
microscopic hair-like tips ultimately disappear into the acrylic. The
smallest
discharges are now thought
to extend down to the molecular level. See our Frequently Asked Questions (FAQ) or our one-page explanation (PDF) for a quick overview of how these beautiful objects are created, or you can get all the details from this web page.
(Sculpture size: 3 x 3 x 2 inches or 7.6 x 7.6 x 5 cm)
What are Lichtenberg figures? A bit of history...
"Lichtenberg figures" are branching, tree-like patterns that
are created by the passage of high voltage electrical discharges along the surface, or inside,
electrically insulating materials (dielectrics).
The first Lichtenberg figures were actually 2-dimensional "dust figures"
that formed when airborne dust settled on the surface of electrically-charged
plates of natural resin in the laboratory of their discoverer, German
physicist Georg Christoph Lichtenberg
(1742-1799). Professor Lichtenberg first observed this in 1777,
demonstrated the phenomenon to his physics students and peers, and reported his findings in his memoir (in Latin): De Nova Methodo Naturam Ac Motum Fluidi Electrici Investigandi (G ttinger
Novi Commentarii, G ttingen, 1777). The English translation of the title is shown in a PDF , "Concerning the New Method Of Investigating the
Nature and Movement of Electric Fluid". Lichtenberg's translated paper
(PDF) is contained in Appendix A of a Masters thesis by Mark A
Payrebrune ("Experimental Morphology of Lichtenberg Figures", McGill University, Montreal, Canada, 1979). The translated document (by Dr. J. Blain, Classics Department at McGill University) contains the following passage that describes Lichtenberg's initial discovery:
"At the beginning of spring 1777, after the completion of the new
Electrophore, everything in my little room was still covered with
extremely fine resinous dust that had settled, between the scraping and
the shaving of the instrument's base or stand, on the walls and books.
As soon as a draft in the air arose, the dust fell, much to my
annoyance, on the conducting disc of the Electrophore. Often afterwards,
when I held the disc suspended from the ceiling of my room, it turned
out that the dust, as it settled on the base, did not cover it
completely, as it previously had covered the disc, but only in certain
areas. Much to my great joy, it gathered to form little stars, dim and
pale at first, but as the dust was more abundantly and energetically
scattered, there were very beautiful and definite figures, not unlike an
engraved design. Sometimes there appeared almost innumerable stars,
milky ways, and great suns. There were arcs, unclear on their concave
side, but radiant on their convex side. Very glittering little twigs
were formed, similar to those which frozen moisture produces on glass
window panes. There were clouds of different shape and shadows that were
visible in varying degrees ... But the most pleasing sight
presented itself to me, when I saw that these figures could not be
easily erased, as I tried to wipe away the dust with a feather or a
rabbit foot. I could not prevent these same figures, which I had just
erased, from shining forth once more, and somehow, more brightly.
Therefore l placed a piece of black paper smeared with a viscous
material on the figures and pressed down lightly. I was able to produce
imprints of the figures, six of which the Royal Society has seen. [Note:
see figures below]. This new kind of Typography has been
extremely satisfying to me, hastening as I was to more remote
preoccupations and having neither the time nor the inclination of
sketching the figures or destroying themall."
During his subsequent studies, Professor
Lichtenberg used various high-voltage electrostatic devices to electrically charge
the surfaces of various insulating materials including resin, glass, and hard
rubber. He then sprinkled mixtures of finely-powdered
sulfur (yellow) and minium
("red lead", now called lead tetroxide) onto the
charged surfaces. He
found that powdered sulfur (which becomes negatively-charged by rubbing against its container) was more strongly attracted to
the
positively-charged regions on the surface. Similarly, frictionally-charged particles of
red lead acquired a positive charge and were attracted to
negatively-charged regions. The colored powders
made previously-hidden regions of stranded surface charges, as well as their
polarity, clearly visible. We now know that these charged surface regions
were previously deposited by small sparks of static electricity. The
sparks deposited isolated patches of electrical charge onto the surface
as they
flashed along the surface of the insulator. Once
deposited onto the insulator surface, the charges remain
stranded for a very long time since the insulator prevents them from moving and dissipating. Lichtenberg also discovered
that the appearance of
positive and negative dust figures was markedly different.
Discharges created by a positively-charged high-voltage
terminal were star-like, with long, branching paths while discharges from negatively-charged terminals were shorter,
rounded, and
fan-shaped or shell-shaped. By carefully pressing a piece of paper onto the
dusted
surface, Lichtenberg found that he could transfer the images onto a piece of paper,
demonstrating what eventually became the modern processes of xerographyand laser printing. The underlying physics that created Lichtenberg's dust figures evolved to become the
modern-day science of plasma physics.
Positive Lichtenberg figure
Negative Lichtenberg figure
The
following demonstration video is a replication of Lichtenberg's experiments
using a mixture of powdered lead tetroxide and sulfur to highlight positive
(yellow) and negative (red) Lichtenberg figures. In the video a Wimshurst electrostatic generator is used as the high voltage source instead of an electrophorus,
as originally used by Lichtenberg, but the principles are otherwise the
same. In the video, branching positive Lichtenberg figures are created first,
followed by shell-shaped negative Lichtenberg figures.
Many other physicists, experimenters, and artists studied Lichtenberg
figures over the next two hundred years. Notable 19th and 20th century
researchers included physicists Gaston Plant and Peter T. Riess (mid-1800's). In the late 1800's, French artist and scientist Etienne Leopold Trouvelot created "Trouvelot figures" - now known to be photographic Lichtenberg figures - using a Ruhmkorff coil as a high voltage source. Other researchers included Thomas Burton Kinraide (1890's), and professors Carl Edward Magnusson, Maximilien Toepler, P. O. Pedersen, and Arthur Von Hippel
(1920's-30's). Most modern researchers and artists used photographic film to
directly capture the faint light emitted by the electrical
discharges. A wealthy English industrialist and
high voltage researcher, Lord William G. Armstrong,
published two beautiful full-color books showing some of his high
voltage and Lichtenberg figure research. Although these books are now
quite scarce, a copy of Armstrong's
first book, "Electric Movement in Air and Water, with Theoretical
Inferences", was made available through the kind efforts of
Jeff Behary at The Turn of the Century Electrotherapy Museum.
In the mid-1920's, Von Hippel discovered that Lichtenberg figures were
actually created through complex interactions between corona discharges
or small electrical sparks, called streamers,
and the dielectric surface below. The electrical discharges deposited
matching patterns of electrical charge onto the dielectric surface
below where they became temporarily stranded. Von Hippel also
discovered that increasing the applied voltage, or reducing the
surrounding gas pressure, caused the length and diameter of
the individual paths to increase.
Riess discovered that the diameter of a positive Lichtenberg figure was about 2.8
times that of a negative figure of the same voltage. The relationships between the size of Lichtenberg figures versus voltage
and polarity were utilized in early high-voltage measuring and recording instruments, such as
the klydonograph,
to measure both the peak voltages and polarities of
high voltage impulses. A klydonograph, sometimes called "Lichtenberg's camera", could photographically record the size
and shape of Lichtenberg figures that were generated by abnormal
electrical surges on electrical power lines due to lightning
strikes. Klydonograph measurements allowed lightning researchers and power
system designers in the 1930's and 1940's to
accurately measure lightning-induced voltages, thus providing critical
information about the electrical characteristics of lightning strikes.
This information allowed power engineers to create
"man-made lightning" with similar characteristics under
laboratory-controlled conditions so that they could test the
effectiveness of
various lightning-protection approaches.
Lightning protection has since evolved to become an essential part of
the design for all
modern
electrical transmission and distribution systems. A schematic
diagram of the active parts of a klydonograph is shown on the leftmost
drawing below,
along with examples of klydonograms from positive and
negative
high voltage transients of various amplitudes versus polarity. Notice
how positive Lichtenberg figures are
considerably longer than negatives figure even though
the peak voltages are of equal magnitude.
A more modern version of this device, called a teinograph, used a
combination of delay lines and multiple klydonograph-like sensors to
capture a series of time-shifted "snapshots" for a given transient,
allowing engineers to capture the overall wave shape of a HV transient
event. Although they were eventually replaced by modern electronic
equipment, teinographs were still used through the 1960's to study the
behavior of
lightning and switching transients on HV transmission lines.
Schematic diagram of a klydonograph showing the position of the
photographic film and high voltage electrode. Light from the high
voltage discharges creates a photographic record of the event.
Comparison of photographically-captured Lichtenberg figures.
Note variation in size versus peak voltage and polarity
Lichtenberg figures are now known to occur during the electrical breakdown of gases, insulating liquids, and solid dielectrics.
Lichtenberg figures may be created within billionths of a second (nanoseconds)
when dielectrics are subjected to very high electrical stress, or they may develop over years through a progressive series of small, low-energy, partial discharges.
Countless partial discharges on the surface or the interior of solid
dielectrics often create slowly-growing, partially-conductive 2D surface
Lichtenberg figures or internal 3D "electrical trees".
2D electrical trees are often found along the surfaces of contaminated
power line
insulators. 3D trees can also form, hidden from view, inside dielectrics
due to the presence of small impurities or voids, or at locations
where an insulator has been physically damaged. Since these
partially-conductive trees can eventually cause the
complete electrical failure of the insulator, preventing
their initial formation and growth is critical to the long-term reliability of
all high-voltage equipment.
The study of electrical trees and their prevention has been critical to
the reliable design of the high-voltage power transmission systems that
transfer electrical power to our homes and businesses. 3D Lichtenberg figures inside transparent plastic were
first created by physicists Arno Brasch and Fritz Lange in the late 1940's.
Using
their newly-invented electron accelerator, they injected trillions of
free electrons into plastic specimens, triggering electrical breakdown and creating carbonized internal Lichtenberg figures. Electrons are tiny, negatively charged particles that orbit the positively-charged
nucleus of the atoms that make up all condensed matter. Brasch and Lange used high voltage pulses from a
multi-million volt Marx Generator
to drive a pulsed electron beam accelerator.
An article about their research and their accelerator (which they
called a "Capacitron") originally appeared in the March 10, 1947 issue of LIFE
Magazine. The Capacitron could deliver a three-million volt pulse, and
could generate a powerful blast of free electrons with an incredible peak current of
up to 100,000 amperes. The glowing region of heavily-ionized air created by the exiting high-current
beam of electrons resembled a bluish-violet rocket engine flame. A complete set of B&W pictures,
including Lichtenberg figures inside a clear block of plastic, has
recently become available online, as has another article with color pictures
from the April, 1951 issue of Popular Mechanics. In 1944, Brasch
founded the Electronized Chemicals Corporation (ECC), a pioneering researcher of using electron beams to
cross-link monomers and polymers to improve their electrical and
physical properties. ECC was eventually purchased by the 3M Company in
1985.
The first formal scientific study of the injection and movement of electrical charges and charge trapping/detrapping within
dielectrics was conducted by Brazilian physicist Dr.
Bernhard Gross in the early 1950's. Dr. Gross confirmed that internal Lichtenberg figures could be created within a number of different polymers
and glasses by injecting them with high-energy electrons from a particle accelerator. The
techniques that we use to make our modern sculptures are built upon the
theoretical work and experimental techniques originally developed
by Brasch, Lange, and Gross. 3D acrylic Lichtenberg figures are
sometimes called "electron trees" or "beam trees". We call our
state-of-the-art creations Captured Lightning sculptures.
How do we make our Acrylic Captured Lightning sculptures? Since 2004, we have developed and refined irradiation and fabrication
techniques to create a wide variety of beautiful 2D and 3D sculptures.
We begin by carefully cutting and polishing various shapes from a clear, glass-like polymer called polymethyl methacrylate (or PMMA).
This material, commonly called acrylic, is sold under various
trade
names such as Lucite, Plexiglas, or Perspex (UK). Acrylic has a unique
combination of
high optical clarity and superior electrical
and mechanical properties. Besides being an excellent electrical
insulator,
acrylic is actually clearer than glass! We have tried a number of other
clear polymers, such as polycarbonate
(PC), polystyrene (PS) , polyester/polyethylene terephthalate (PET), epoxy, and clear polyvinyl
chloride (PVC). Lichtenberg figures can be made inside all of these
polymers with varying
degrees of success. However, the branches tend to be dark gray or even black instead
of the sparkling white, mirror-like figures seen within acrylic. We
have also experimented with making Lichtenberg figures in glass. However, since glass Lichtenberg figures often explosively shatter upon discharge or, unpredictably, days or even months later, we no longer make them.
We inject electrons into acrylic specimens using a 5 million volt, 150 kW commercial particle accelerator called a Dynamitron (PDF), The heart of this device is the accelerator tube - a huge three-story
high "vacuum tube" that operates at voltages between one and
five million volts. At the top of the tube, electrons are emitted by a
small, white-hot tungsten filament. The filament is connected to
the negative terminal of an adjustable multi-million volt power supply. The bottom of the tube is
connected to ground and the positive terminal of the high voltage supply. This configuration creates a very strong
electrical
field that accelerates electrons emitted from the filament. As they
"fall" though the large potential difference, and they acquire a very
high velocity. The
bottom of the vacuum tube has very thin (only 2.3 thousandths of an
inch thick!) titanium
window that separates the high vacuum on the inside
from atmospheric air on the outside. The high-velocity electrons pass
right through
the titanium window, almost as though it wasn't there! Trillions of free
electronsemerge
through the outside surface of the window, travel
24 inches through air then crash into our acrylic specimens on the
moving carts below. Although the average lifetime of free electrons in
air is only 11 billionths of a second, that's more than enough
time for them to work their magic on our acrylic specimens.
The energy of the accelerated electrons is measured in millions of electron volts (or MeV).
Most of our sculptures were created using electrons that had energies
between 2 and 5 MeV. At these energies, electrons are traveling at relativistic velocities - between 98.5% and 99.6% of the speed of light. During irradiation,
these energetic electrons burrow deep inside the
acrylic before finally coming to rest. The penetration depth is a
function of
the energy of the electrons in the beam, the target material's
dielectric properties, and its atomic density. The charging process
is called "deep dielectric charging". The higher the energy of
the electrons in the beam, the deeper they penetrate. For example,
electrons with an energy of five MeV will
penetrate about one-half inch into acrylic, but a 1/16-inch thick piece of much denser lead will completely block them.
When
a thick piece of acrylic is irradiated, huge numbers of electrons
accumulate
inside the specimen, creating a strongly-charged cloud-like layer called
a space
charge. Because acrylic is an excellent electrical insulator, injected
electrons become temporarily trapped inside the acrylic. By passing
thick specimens
through the electron beam in two or more passes, changing specimen
orientation between passes, or rotating them while they're
being irradiated, complex 3-dimensional space charge regions can be
created inside the acrylic. As electrons accumulate during irradiation, the
electrical stress (called the electric field or "E-field") inside
the acrylic dramatically increases, reaching several million volts
per
centimeter. We normally charge our specimens to just below the point
where they'll break down. We then force the charged specimens to release
("discharge") the electrons at the desired location by poking them with a
heavily-insulated, pointed
metal tool. This creates a small fracture that greatly concentrates the E-field at that point. The intense electrical field at the tip of the fracture overcomes the dielectric strength of the acrylic, initiating complete electrical breakdown of the specimen. During breakdown, some of the chemical
bonds that held acrylic molecules together suddenly break, stripping away free electrons in a process
called ionization.
The newly-freed electrons become accelerated by the
extreme electric field, and as they collide with other
molecules, they rapidly create an ever-increasing number of new electrons in an exponentially-growing runaway process called avalanche breakdown.
Within
billionths of a second, a tree-like network of white-hot plasma channels form within
the acrylic and, with a bright flash and a loud BANG, the
material undergoes complete dielectric breakdown.
The previously-trapped electrical charges rush out in a river-like
torrent. Thousands of smaller tributaries dump their
share of stored charge into larger channels that eventually merge into a
single, brilliant discharge path that exits the acrylic. Although images
and videos appear to suggest that we're injecting high voltage into each piece, we are
actually removing the excess
charges that were previously trapped inside each piece. Dielectric breakdown occurs with incredible speed - the main electrical discharge
within a 4-inch square specimen lasts less than 120 billionths of a second! Some physicists think that dielectric
breakdown within a charge-injected solid may be the most energetic
(explosive) known chemical reaction.
The
following image shows a 12 x 12 x 1 inch
specimen being discharged. The camera settings were adjusted
to reduce the brilliance of the discharge so that individual plasma
channels can be
seen. Note the bright descending discharge that exits from the discharge
point, across the top surface of the specimen, and then to the grounded
metal table below:
(Photo courtesy of Terry Blake)
As the miniature lightning bolts blast
their way through the solid acrylic,
they
create millions of microscopic tubes and fractures, leaving behind a
permanent "lightning fossil" deep inside the acrylic. The peak discharge
current is typically hundreds of amperes for smaller specimens, to
thousands of
amperes for larger museum sculptures. The white-hot high-density plasma
within the
confined discharge channels causes part of the walls of the surrounding
acrylic to vaporize
and fracture. Higher-current main channels sometimes char the
surrounding acrylic. The
exit point of the discharge creates a small crater on the surface as hot
gases explosively exit the specimen.
Surprisingly, although we inject a huge number of negative charges into
our specimens, the electrical discharges grow from spark tips which are
more electrically positive than the nearby space charge. As a result,
all of
our Captured Lightning sculptures are "positive" Lichtenberg
figures! As single-discharge branched figures continue to split, the
paths
become finer, filling the charged area. However, they never cross or
form
loops, and the microscopic tips eventually disappear into the acrylic.
Some specimens self-discharge as they're being irradiated by the
electron beam. This
is often caused by a small surface scratch or imperfection, left-over
manufacturing or fabrication stresses, or an internal defect, such as a
small bubble or inclusion inside the acrylic. A
self-discharged
specimen will continue to discharge numerous times while it is being
irradiated as the electron beam continues to inject new charge into the
specimen. Unlike the neatly-branched structures seen in
manually-triggered sculptures, self-triggered sculptures typically
develop a
thicker, mat-like tangle of chaotic discharges, or a complex combination
of
dendritic and chaotic patterns. Because of their complexity,
self-discharged specimens are often among some of our most fascinating
sculptures.
Video clip of a huge 15 x 20 x 2 inch sculpture being discharged: Following
is a short video clip showing a huge 15" x 20" x 2" specimen being
discharged. The specimen was first
charged on one side using a 5 MeV electron beam. The electrically-charged
specimen was then (very carefully!) flipped over and irradiated once
more on the other side. This created two independent charge layers,
each located about 1/2" below the large surfaces. Prior to discharging,
the estimated potential of these internal layers was over 2.5
million volts. Because there were two very large charge layers, this
specimen stored significantly more electrostatic energy than most of our
other specimens - more than four kilojoules! Safety precautions were
necessary to prevent the possibility of receiving a painful, and potentially dangerous, electrical
shock.
Although the main discharge is quite brief (under 500 billionths
of a second for this specimen), the video successfully captured the brilliance of the 4
kilojoule electrical discharge in a single video frame (shown below). Numerous
secondary discharges continued to intermittently flash after the main discharge. These
continued with decreasing frequency for over 30 minutes. This video is courtesy of
Dr. William Hathaway, GCL Laboratories. The resulting sculpture, cradled within
a custom walnut light base and illuminated by an array of white and
blue LED's, is also shown below.
(Click on above image for high-resolution image)
The resulting Lichtenberg Figure is a series of branching hollow tubes surrounded by conchoidal
(shell-shaped) fractures. Conchoidal fractures are characteristic of the way that glassy (amorphous)
materials fracture when stressed beyond their breaking point. Since the
countless
fractures behave as tiny mirrors, illuminating a figure through the
edges causes the entire Lichtenberg figure to glow brilliantly
with the reflected colors of the external light source.
Lichtenberg figures have fractal properties
The
branching pattern of a Lichtenberg figure looks similar at various scales of
magnification. This property is called "self-similarity", and it suggests that Lichtenberg
figures can be mathematically described through a branch of mathematics called Fractal Geometry.
Unlike most common geometric forms, fractal-like objects do not have
even-integer dimensions. Instead, they
have dimensions that lie between 1 and 2 (for 2-dimensional fractals) or between 2
and 3 (for 3-dimensional fractals). Lichtenberg figures
may be one of the first fractal-like forms created by man. Our
branching 2D Lichtenberg figures have a
fractal dimension that varies between 1.5 (for thin, sparsely branching discharges) to 1.9 for
dense, fern-like bushy discharges. Most of our standard 2D sculptures have a
fractal dimension of about 1.7. Our 3D sculptures typically have a fractal dimension of about 2.5.
The appearance of
the resulting Lichtenberg figures depends upon how much charge was injected into the
acrylic and where and when the specimens are discharged. The technical terms for branching figures are dendritic or ramified(tree-like). If a larger amount of electrical charge is injected
into a specimen, very dense dendritic discharges can be created such as
in Figure 1 below. These very dense discharges are similar in appearance
to fern fronds ("filiciform") or plume agates.
Specimens exhibiting this
form were heavily charged to just below the point of self-breakdown and
then immediately discharged. If we reduce the amount of injected charge,
more classical, lightning-like or tree-like discharges are created
(Figure 2). If premature breakdown occurs while we're actively
irradiating
a specimen, the resulting discharges form a thicker, densely tangled
mat of "chaotic"
discharges
(Figure 3). The fractal dimension of chaotic discharges is currently
unknown. In chaotic discharge specimens, after the initial breakdown,
newly-injected electrons from
the accelerator recharge smaller nearby regions, causing them to
repetitively discharge in random directions into existing discharge channels. The rapidly changing
internal electrical fields create a much thicker mat of densely chaotic
discharges that
are reminiscent of interconnected nerve cells and neural networks.
Some of the most complex and fascinating patterns
occur when a specimen self-discharges about halfway through the charging
process, creating dramatic discharges that change from being densely dendritic
to densely chaotic across the sculpture.
(Click for larger image)
Figure 1. Dense (filiciform or fern-like) Discharges
Maximum charge density
Fractal dimension ~1.8 to 1.9.
(Click for larger image)
Figure 2. Dendritic Discharges
Moderate charge density
Fractal Dimension ~1.5 to 1.8
(Click for larger image)
Figure 3. Chaotic Discharges
Prematurely discharged
while being irradiated)
Unknown fractal dimension
The
self-similarity of dendritic discharges can easily be seen in the
following sequence of zooms from a 12" x 12" Lichtenberg Figure.
Although the branches become finer and hairlike, the overall branching
structure remains similar until the finest tips ultimately disappear at
the very edges of the discharge structure. Some recent research suggests that this dendritic pattern may extend to the molecular level.
Similar fractal-like patterns are prevalent in nature. They are seen in
aerial views of rivers and their tributaries, and organic structures
such as branching tree limbs, your body's circulatory system, and within
various organs such as lungs, kidneys, and the liver. The satellite
view in the left image below shows a river
drainage system near Grand Junction, Colorado, USA. The rightmost image is a
casting of the bronchial tree of a human lung (courtesy Paul Cazeaux,
PhD student at Laboratoire Jacques-Louis Lions (LJLL), Paris, France).
The similar branching structure of all of these systems may be a
consequence of a recently proposed new law of physics, theConstructal Law,
which states that Nature tends to develop a hierarchical branching
network of paths that result in most efficient flow. The flowing
material can be water, air... or even electrons!
Lichtenberg figures can be mathematically modeled using an iterative growth process called "Diffusion Limited Aggregation" (DLA). A more accurate model, that combines an electric field with DLA, is called the Dielectric Breakdown Model (DBM).
The DBM appears to accurately describe the forms of Lichtenberg
figures that occur under various electrical field intensities on the
surface or within solid, liquid, and gaseous insulators.
Other interesting properties: fluorescence, solarization, birefringence, and the discharge-free zone When
acrylic is bombarded by high-energy electrons, it glows brilliantly
with a blue-white color. Radiation chemistry studies suggest that this
is mainly due to luminescence that peaks at a wavelength of about 435 nm. However, acrylic also generates fainter glows from X-ray fluorescence, and Cherenkov radiation
as high velocity electrons interact with acrylic molecules. The
detailed light-producing mechanisms for electron-irradiated acrylic are
not fully understood.
Newly-irradiated specimens develop a discolored layer in the region
between the irradiated surface(s) and the
discharge layer. This phenomenon, called solarization, appears to be caused by various interactions between the injected electrons and the molecular structure of the acrylic. During
irradiation, electrons in the beam are initially traveling at over 99%
of the speed of light. As they penetrate the specimen, they collide with
acrylic molecules, rapidly coming to a stop within a fraction of an
inch. Electrons in the beam have considerable kinetic energy,
and as they collide with the atoms in the acrylic they release this energy
as heat and x-rays.
In acrylic, most solarization seems to occur in the regions directly
hit by the electrons. However, regions that are intentionally covered by sheet lead (to prevent
electrons from hitting some areas of the acrylic) may also exhibit
solarization within deeper regions of the acrylic. As electrons crash into
the lead mask, they radiate intense x-rays that apparently create a darker region of
solarization in the acrylic immediately underneath the mask.
Energetic collisions with electrons, x-rays, and the build-up of excess electrons stimulate chemical and
physical reactions that alter the physical and optical properties of the
acrylic. Deeply-trapped electrons may remain stranded within the
acrylic for several years. These create color centers
which also contribute to solarization. While some of these changes may last
for only minutes, others persist for months or years after
irradiation, and some appear to be permanent. Although all of the specific causes
of solarization are not completely understood, there is evidence that
irradiation creates longer-lived unstable ("metastable")
compounds that preferentially absorb light at the blue end of the
spectrum (wavelengths between 250 and 400 nm). Since a portion of the
blue spectrum of ambient light
is absorbed by the solarized region, freshly-irradiated specimens
typically appear green, amber, or sometimes even rose-colored when
illuminated by white light.
The solarization layer in charged acrylic specimens is most often lime-green immediately
after irradiation. Within minutes of being discharged, the solarized layer changes to
brownish-amber, then fades to a lighter amber color over weeks or months. The
amber region usually fades away over months to several
years. The fading process can
usually be accelerated by heating
the
block in the presence of air or by leaving the specimen
in bright sunlight for an extended period of time. As oxygen diffuses
into the
acrylic from the outside surfaces and the porous discharge layer,
it
slowly bleaches the solarized region, causing the solarized layer in between to
gradually become thinner until it eventually disappears entirely.
Most Lichtenberg figures older than 2-3 years are completely bleached. Although older
specimens may no longer show any solarization, many exhibit various
degrees of "fogging" from electron collisions and X-radiation damage to the acrylic's molecular structure.
Some PMMA specimens exhibit
comparatively little initial solarization, while a small percentage of other
specimens permanently retain their amber color. Permanently-colored specimens
appear to be solarized via a different, deeper penetrating mechanism,
such as X-radiation, since these specimens also tend to be uniformly
solarized throughout their entire thickness. These differences may be due to subtle variations in the acrylic blends and the specific catalytic agents used by acrylic manufacturers to polymerize the acrylic.
The solarized layer is often fluorescent.
An amateur scientist from Australia, Daniel Rutter, discovered that monochromatic light from a green laser pointer apparently changes color
when passed through the solarized layer of a Lichtenberg figure. More
recently, we have discovered that the light from a near-ultraviolet
source, such as a 405 nm Blu-ray laser or blue LED's, also causes the
solarized region to fluoresce with a yellow-green color. Both effects
appear to be due to the presence of semi-stable fluorescent components within the
solarized layer. And, as the solarization fades over time, so does the
fluorescence.
Most specimens also exhibit slight changes in the
refractive index
in the regions near the discharge layer. This may be due to
residual mechanical stresses near the discharge
fractures or residual electrical charges. Residual
stresses near the Lichtenberg figures can sometimes be seen as
multicolored regions near the discharge plane when a sculpture is
illuminated by polarized
light and then viewed through a second polarizing filter, a
configuration called crossed polarizers. When physically stressed
mechanically or by a large electrical field,
acrylic exhibits a property called birefringence.
When viewed through crossed polarizers, stress- or
electrical-field-induced birefringence
causes changes in color that are directly related to the amount and
distribution of otherwise hidden mechanical and electrical stresses. The
sample below clearly show internal compressive forces created by the
high
internal electrical field. These forces are then mostly relieved when
the
specimen is
discharged. Following are images of the same specimen prior to charging,
fully charged, and then after discharging. Little internal stress is
seen in the initially uncharged specimen. The specimen was then charged
by injecting electrons from the left side. The injected charge forms an
intensely negative layer of charge near the center of the specimen. At
the same time, positive ions (created in the air by collisions between
air molecules and the high-energy electrons in the beam) are strongly
attracted by the internal negative charges. The positive ions attach
themselves to the external
surfaces of the specimen. The outer positive "mirror" charge layer
partially
neutralizes the electrical field created by the internal negative charge
layer, dramatically reducing the electrical field seen outside
the specimen. Attraction between the internal negative
layer and the positively-charged outer surfaces create intense
compressive stresses within the acrylic. For the specimens below, the
compressive force created between the charge layers is approximately 400
pounds per square inch (PSI).
The compression can easily be seen as
colored regions on either side of the center in the middle image. After
the specimen is discharged, both the electrical and mechanical stresses
are greatly relieved
as can be seen in the rightmost image. There are still residual
mechanical stresses near the discharge zone due to all the microscopic
fracturing, and residual electrical stresses left over from embedded
charges that were not removed by the main spark discharge. Click on
any of the individual images below to see full-sized images. Further
study, using a monochromatic light source, is planned for the future.
Initially uncharged specimen
Fully charged specimen
(electrons were injected from left side)
Discharged specimen
Finally, all of our sculptures have a
discharge-free
zone along the outside boundary. Since acrylic is not a
perfect
insulator, some of the injected charge "leaks away" through the
perimeter that separates the internal negative space charge layer and
the positively-charged outer surfaces. The charge leaks away most
quickly in those areas where the
electrical field is greatest, such as along the perimeter. The boundary
is also influenced by positive charges on surface of the specimen. As
propagating
streamers approach the edges of the sculpture, the electrical field
"seen" by the tips of the
growing discharges is dramatically reduced as they approach the positive
surface charges. As the advancing streamer tips approach the outer
edges, most streamers thin and die out. However, some discharge tips
suddenly make an abrupt turn and then continue to grow parallel to the
nearby edge. We suspect that the positive charges on the
large outer surfaces force the discharges to be confined to a thin
layer, parallel to the
outer surfaces of the specimen.
"Iced 'bergs" and negative Lichtenberg figures. And, do we get curved figures in a magnetic field? From studies done by other researchers, we knew that acrylic specimens
could retain their injected
charge for weeks, or even months, if
chilled, irradiated, and subsequently maintained at dry ice
(-109F/-78.5C) temperatures. One of our team members, Todd
Johnson, has christened these frozen objects as "Iced 'bergs". At room temperature,
injected charge leaks away over a few minutes to a few
hours for commercial acrylic. Chilling acrylic
significantly reduces the speed that free charges can move inside the
acrylic, and this dramatically increases the time that trapped charges
can be stored. At dry ice temperatures, trapped charges can apparently
be stored indefinitely. We have confirmed virtually full charge
retention over
several weeks, and
other researchers have demonstrated charge storage for up to six months.
When later discharged, these specimens behave in a fashion similar to
freshly-charged specimens. The initial lime-green color of the solarized layer is also retained in
chilled specimens until they are discharged. This suggests that the green color
is
related to the high density of electrons that remain
trapped before discharging. Or perhaps this proves that electrons are green? Anyway, once discharged, chilled specimens rapidly
lose their green color, changing to an amber color.
Chilled specimens develop a heavy layer of frost when
exposed to humid air. When we discharge a specimen, we produce a
"positive"
Lichtenberg figure inside the acrylic. Photographic evidence confirms
that the exiting sparks then "wrap around" the exterior surfaces of the specimen. As the surface
sparks cover the exterior, they discharge the positive surface charges that attached themselves to the
specimen. As the external surface discharges branch out, they
produce a
"negative" Lichtenberg figure along the large surfaces of the specimen.
However, the negative surface discharges are considerably fainter than
the
brilliant internal discharges, so they're quite
difficult to see or photograph. We accidentally discovered that, when a
charged specimen is coated with frost, the negative discharges along the
acrylic
surface blast away the frost layer immediately above the discharges.
This makes the main paths taken by the negative discharges clearly
visible. The following "iced 'berg" was discharged by Todd
Johnson and Dr. Timothy Koeth during our 2010 production run. As
can be seen, the resulting negative Lichtenberg
figures that blasted through the frost layer show considerably less
branching
than positive
internal figures... just as professor Lichtenberg observed
over 200 years ago. Other experimental evidence suggests that the
"branching
angle" (at the fork where a discharge path splits) for negative
discharges is centered around 29 degrees, while the branching angle of
positive discharges appears to be centered around 39 degrees. I'm sure
there's a reason for this, but I certainly don't know what it is.
We also wondered if an externally-applied magnetic
field might cause discharge paths inside the acrylic to become curved.
It was known that Lichtenberg figures created within gases along
dielectric surfaces become curved due to Lorentz force acting on the
moving charged particles within the electrical discharges. The stronger
the magnetic field, the greater the curvature:
Since we could chill charged specimens to dry ice temperatures and keep them charged indefinitely, it became possible to perform
tests on charged specimens in a more controlled laboratory environment.
Following our Fall, 2007 production run, Dr. Timothy Koeth placed a
chilled and charged specimen within the poles of a 1.5T (15,000 Gauss)
cyclotron electromagnet in his lab and then discharged it using a non-magnetic tool while it was
within the magnetic field. The blue-white flash of the electrical discharge
can be easily seen along the edge of the specimen in the photo below:
Image courtesy of Dr. Timothy Koeth
The above image shows the result. The pole pieces and region of maximum
magnetic flux are shown by the overlaid red circle. As can be seen, the paths of
the resulting
Lichtenberg figure showed no evidence of any curvature. The paths
look completely identical to control specimens discharged with no
applied field. It's possible that the 1.5T magnetic field was simply not
strong enough to show any effect. Or perhaps the net velocity of the
electrons within the discharges inside acrylic is
considerably slower than within gases, so the resulting Lorentz force
is lower and the degree of curving is considerably smaller. A future
experiment, perhaps using a stronger electromagnet, may allow us to
create
magnetically-curved paths.
Discharge speed and current measurements... and a paradox
During our 2007 and 2009 production runs, we
measured and recorded discharge current wave forms for a number of 4" x
4" x 3/4" specimens. We designed a special holding fixture with copper
foil plates that made physical contact with the large outer surfaces of a
charged acrylic specimen. A heavily-insulated wire connected the pair of
foil plates to a pointed discharge tool. This wire was also passed
through the center of a Pearson Model 411 wideband Current Transformer
(CT). When the specimen was discharged, the main current pulse flowed
from the interior charge layer,
through the wire (and center of the CT), to the oppositely-charged outer
surfaces of the specimen. The resulting discharge current was converted
to a voltage pulse via the CT - the conversion factor for this
particular CT was 0.1 volt per amp. So, every 100 amps of discharge
current would show up as 10 volts of output from the CT. The resulting
waveform was captured and stored by a Tektronix TDS3034B
300 MHz digital storage oscilloscope (DSO). An image and schematic of the experimental configuration can be seen below:
Specimens were previously charged by injecting a cumulative charge of ~2.7 microCoulombs/cm2 using an electron beam with a nominal beam energy of 4.0 MeV. Charged specimens were then placed inside the test fixture and manually discharged. The discharge current wave forms from one of the specimens is shown below. We found thatthis main discharge event occurred in less than
120 billionths of a second (120 ns), the peak current reached almost 600
amperes in 45 ns, and the waveform contained four discrete current
peaks. Discharges from five subsequent specimens showed similar discharge intervals, with from three
to seven discrete current peaks. Overall, the peak discharge currents declined as the time between irradiation and discharge increased. This decline was expected because the injected charge slowly leaks away, reducing the amount of remaining energy and the peak discharge current. Subsequent peak current measurements on the other specimens ranged from 526 to 404 amperes.
The occurrence of multiple current peaks suggests that the electrical trees may progress via a
series of larger breakdown events. Each current peak reflects a
surge of newly conducting channels ("streamers" and "leaders") as newer channels blast
their way into previously untapped reservoirs of charge within the
acrylic, pause briefly, then surge again, etc. The average discharge
velocity was between 8.5 x 10⁵ and 1.3 x 10⁶ meters/second (526 and 790
miles/second, or around 0.3% the speed of light). However, pauses
between successive current surges suggest that the peak discharge
velocity during the propagation phases are significantly faster. Surprisingly,
the average streamer velocity within the specimen was found to be 10-100 times
greater than the velocity of positive lightning leaders in air! This is
thought to be due to the extreme electrical field (estimated to exceed
20 million volts/cm) at the tips of the propagating discharges.
The
high streamer velocities within PMMA create a paradox, since they are
over 800 times the speed of sound within PMMA. This is completely
inconsistent with Griffith's theory of crack propagation within solids,
which predicts that the maximum speed that cracks can propagate within a
solid is limited to the speed of sound within the material (about
1.6 x 10³ meters/second for PMMA). The current waveform clearly
demonstrated that the breakdown process (the complete formation of
chains of cracks and gas channels across the specimen) for our
Lichtenberg figures propagated at speeds that were almost 1000 times
FASTER than the maximum predicted by classical fracture theory! A
series of independent electro-optical measurements were taken by Dr. Timothy
Koeth in his laboratory at the University of Maryland. Dr. Koeth
measured the time delay between optical (light) emissions at the
beginning and ends of propagating discharges within 6" x 6" x 1"
specimens. His optical measurements also confirmed streamer velocities ranging between 7.4 x 10⁵ and 1.55 x 10⁶ m/s.
Some insights into this paradox may come from a Russian researcher, Yu
N. Vershinin. Dr. Vershinin explored how electrostatic energy is
stored
and released within solid dielectrics during electrical breakdown.
Specifically, he studied how
energy is stored within acrylic when electrical charge is slowly
injected into the material ("charge trapping"), and the effects of
rapidly releasing these trapped charges ("charge detrapping") during
electrical
breakdown processes. Vershinin proposed that, when a dielectric contains
significant trapped space charge, the stored electrostatic potential
energy may be rapidly liberated, contributing to the explosive formation and
growth of crack tips. As chemical bonds in the surrounding material are
ruptured, some of the material breaks down into its molecular or atomic constituents,
liberating high pressure gases that rapidly expand the channels
behind the propagating crack tips, forcing the crack forward. Vershinin
speculated (and
experimentally confirmed) that for very high internal electrical fields
(E-fields), the potential energy initially stored within the fields was
rapidly converted into kinetic and thermal energy that drove crack
propagation at hypersonic velocities. When mechanically shocked, a
dielectric material that is highly stressed by an electrical field breaks
down, explosively releasing energy that was previously stored within the electrical field,
causing larger molecules to break into into smaller, gaseous
byproducts. Breakdown occurs along rapidly propagating reaction fronts
(streamers), accompanied by shock waves.
Vershinin speculated that dielectric breakdown might be closely related to the process of detonation.
He found that "electronic detonation" did indeed occur within solid
dielectrics, but only for propagating positive discharges within highly
divergent
E-fields - the very same conditions we create when making acrylic
our acrylic Lichtenberg figures! An American researcher, Dr. Paul Budenstein,
independently
developed a theory of dielectric breakdown in solids that seems to
explain many of these observations at a more fundamental level. Based
upon the rate of channel
expansion, Budenstein concluded that dielectric breakdown may be the
fastest known chemical reaction in nature. During
the breakdown process,
disassociating dielectric molecules create a network of
electrically-conductive plasma channels that initially have nearly the
same density as the surrounding solid material. Budenstein estimated
that the initial temperature
of the dense plasma inside these highly-compressed channels reached 100,000 K
before
they supersonically expanded to create a network of hollow tubules and
fractures that eventually form the resulting Lichtenberg figure.
Spectral analysis shows that the initial dense plasma consists of atomic
constituents of the parent dielectric, not molecular compounds. The
breakdown process along each channel appears to progress in a series of
discontinuous steps: gas pressure creates, and then expands, a crack
into the
virgin material ahead, stops temporarily, then repeats as gas expands in
the newly-created crack.
Some evidence for the above theories of breakdown and discharge
propagation
can be seen within our Lichtenberg figures. Under a
microscope, some of the discharge channels that make up the figures are
found
to be hollow tubes, surrounded by countless small fractures that
scatter light. Some paths clearly exhibit periodic structures along the
discharge channel, similar to beads along a string. These
beaded
structures are observed during dielectric breakdown of various polymers
as well as crystalline ionic salts. The theories predict that the
extreme
electrical field ruptures the chemical bonds within the acrylic. The
resulting electronic breakdown processes
liberate gases as some of the insulating material is rapidly decomposed
into its
atomic constituents. Dr. Timothy Koeth has confirmed that a significant
volume
of gas exits from the discharge point when an acrylic specimen is
discharged
under water. Other researchers have determined that the evolved gases
consist primarily of hydrogen, methane, carbon monoxide, and carbon
dioxide. We've also observed a flame lasting for several seconds after
the main discharge at the discharge point on some of our largest
specimens. "Beading" appears to reflect a repetitive sequence of
electronic
decomposition, evolution of gases under high pressure, and
formation/growth of
new cracks ahead of the expanding gas zone. Following is an example of a
microscopic beaded channel captured inside one of our sculptures by Dr.
Bill Hathaway (GCL Laboratories).
The approximate horizontal distance shown in the image below is two millimeters.
We have experimentally confirmed that "electronic detonation" during the main discharge is 10 to 100 times faster than the detonation
velocity of the fastest known chemical explosives.
The stored electrostatic energy in larger specimens can exceed several
kilojoules. Since this energy is typically discharged in a fraction of a microsecond, the
instantaneous power liberated when creating a Captured Lightning
sculpture can easily exceed a gigawatt
(109 watts)! Not surprisingly, the discharge
creates a very loud
BANG(!) as the brilliant, lightning-like spark channels wreak havoc inside the acrylic, blasting countless fractures
and tubes all along the space charge layer(s). The abrupt release of
previously-trapped space charge ("charge detrapping") is
now known to play a major role in the degradation and breakdown of
all solid dielectrics when subjected to long-term high voltage
stresses,
sudden voltage changes, or abrupt polarity reversals. In many respects,
charge detrapping within a solid dielectric is analogous to a
high-voltage capacitor discharge that occurs entirely within the insulating material.
After the main discharge creates the Lichtenberg figure, hundreds of smaller secondary electrical
discharges continue to flash throughout the specimen as pockets of
residual charge redistribute themselves.
Immediately after the main discharge, large
sculptures sparkle and sizzle, making a sound similar to frying bacon.
In large specimens, intermittent sparking has been observed over 30
minutes after the main
discharge. Harmless secondary discharges often sting our fingers
when we handle recently-discharged specimens. Click on the following
image to see some high resolution video captured during one of our
production runs that shows primary and secondary discharges.
(Photo and video courtesy of Mike Walker and Theodore Gray) Click on the Above image to see a video clip
of many Lichtenberg figures being discharged
Natural Lichtenberg figures - fulgurites, natural tattoos, and fractal lightning
Occasionally, nature creates also "fossilized lightning", called fulgurites
(from the Latin word "fulgur", or lightning). These are hollow, glass-lined tubes that are formed when the powerful
electrical current from a lightning strike creates underground discharge
channels within poorly-conducting sandy or sandy-clay soils. The
intense heat from the arc-like channels melts the surrounding sand
and soil particles, forming hollow glassy tubes in the soil. Larger fulgurites often exhibit
fractal characteristics as they split into smaller diameter root-like
branches at further distances from the site of the main strike.
Lichtenberg figures, sometimes called "lightning flowers" or "skin feathering", often form
beneath the skin of unfortunate humans who have been struck by lightning. The victim often has one
or more reddish radiating feathery patterns that branch outward from
the entry and exit points of the strike. Here's an example of an electrical tattoo from a lucky lightning survivor:
OUCH! A temporary lightning tattoo on a "lucky" survivor From "Lichtenberg Figures Due to a Lightning Strike" by Yves Domart, MD, and Emmanuel Garet, MD,
New England Journal of Medicine, Volume 343:1536, November 23, 2000
Medical
terms for this phenomenon include arborescent lightning burn, arborescent (tree-like) erythema, keraunographic markings,
or ferning patterns, and they occur on 20-30% of those struck by lightning.
Although the exact causes are still subject to debate, the markings
appear to be the result of physical damage to capillaries under the
skin, perhaps caused by the flow of electrical current, or by shock wave
bruising from external flashovers just above the skin. Skin in the
affected areas is not burned. Instead, a small number of blood cells
(apparently from damaged capillaries) leaks into the surrounding
subcutaneous fat, causing a reddish discoloration. The
marks usually fade away (on survivors!) over a period of a few hours to a
few days as the body reabsorbs the loose blood cells and repairs the
damaged capillaries. They are recognized by
forensic pathologists as clear evidence that a victim has been struck by
lightning. The patient above survived with no permanent injuries, and
the lightning flowers completely faded within a few days. A small
Lichtenberg figure has also been observed at the entry point where a
high voltage spark penetrated the skin of an unfortunate (but surviving)
local electrical experimenter who was accidentally zapped by a homemade
60,000 voltMarx Generator. No... it wasn't me!
A similar phenomenon is sometimes seen when lightning
hits a grassy field, such as the following image where lightning struck a
golf course flagpole, leaving this beautiful 25 foot Lichtenberg figure on the
green:
(From "Lightning and Lichtenberg Figures" by Cherington, Olson and Yarnell, Injury, Volume 34, Issue 5, May 2003)
Note the similarity between the figure above and the Lichtenberg figure below (illuminated from below by blue LED's):
High voltage discharges to the surface of water can also create Lichtenberg figures. Some beautiful examples of
both positive and negative Lichtenberg figures on water surfaces can be seen on Dr. Colin Pounder's Lichtenberg figures web site. Natural lightning often creates transient "Lichtenberg figures" in the sky. Air
is an excellent dielectric and, although the physical breakdown
mechanisms for air and Plexiglas are considerably different, the
branching structure of the discharges is actually quite similar. So it
should not be surprising that the branching forms of propagating lightning leaders also have fractal
characteristics. This similarity can clearly be observed during so-called 'anvil crawlers' and horizontal spider lightning.
Spider lightning follows a thin, positively charged cloud layer that
sometimes forms within dissipating storms. These slowly propagating
discharges
have been known to "crawl" across the sky for up to 70 miles, literally
crossing the sky from horizon to horizon! On a much smaller scale, transient Lichtenberg figures
(sometimes mistakenly called St. Elmo's Fire) sometimes appear on the
outer surface of cockpit windows of airplanes as they fly near
thunderstorms.
Similar branching fractal patterns also occur when thunderstorms generate electrically conductive leaders that
propagate downward from a charged cloud to the ground below. When one
of these leaders connects with an unfortunate object on the ground, a high current pulse (called the return stroke) surges back upward through the completed path, resulting in a Cloud-to-Ground (CG) lightning
strike. The peak current is typically tens of thousands of amperes, and large positive bolts may reach several hundred thousand amperes. Exceptional examples of downward propagating positive leaders have been captured by South Dakota lightning
researcher, Tom Warner. Using high speed video imaging equipment, he
was able to capture the downward progression of leaders and the return
strokes from a positive lightning bolt. Positive lightning
is a significantly rarer, and considerably more dangerous, form of lightning than negative lightning. Tom's "slow motion" videos show the air breaking down, forming
glowing conductive plasma paths (called leaders) that fan
downward from a huge reservoir of excess charge within the cloud
above. The brightly glowing tips of the positive leaders smoothly propagate,
unlike negative leaders which propagate in a series of discrete jumps (called stepped leaders). The first descending leader to finally connect with the Earth below
completes the circuit, resulting in a powerful Cloud-to-Ground (CG) lightning discharge. See Tom's web site to see his spectacular galleries of images and videos of positive and negative lightning.
Under special conditions lightning can form transient upward-growing Lichtenberg figures. This phenomenon often occurs when
broadcast antennas or mountain tops generate positive leaders that
propagate upward into heavily-charged negative regions above. As the
ground-based positive leaders propagate into the negatively-charged
regions, they form densely-branched positive Lichtenberg figures that,
except for their massive scale, look quite similar to the positive Lichtenberg figures inside our Captured
Lightning sculptures. This fascinating phenomenon has recently been
captured in slow-motion by lightning researcher Tom Warner:
Lichtenberg figures can also be seen at some high energy pulsed
power facilities, especially where deionized water is used as a dielectric to briefly store large amounts of electrical energy. The following photo is from Sandia National Laboratory's mighty ZR
Machine, the world's most powerful electrical pulse generator.
After the completion of a high energy experiment, the water breaks down
from the
huge electrical stress, becoming an electrical conductor that safely
dissipates unwanted
residual energy from the system. The filamentary breakdown paths form
Lichtenberg figures that dance across the water's surface. If you look
closely, you'll notice that many of the
paths actually trace out high voltage electrical field lines along the
surface of the water. Although
impressive, this display is only dissipating "left over" energy after
the experiment is over. The discharges below only represent ~5% of the initial energy that was actually used during the
previous pulsed-power experiment.
(Click for a higher resolution image)
Are there practical uses for Lichtenberg figures? Analysis
of the form and origination points of Lichtenberg figures can be a powerful
tool for diagnosing, and subsequently preventing, high voltage
breakdown of
solid dielectrics. By examining these figures in high voltage equipment, experts can diagnose and
prevent future electrical faults within a variety of devices including high voltage power transformers,
capacitors, and insulators. Historically,
Lichtenberg figures (created by HV measuring equipment such as Klydonographs)
were also a powerful tool for measuring the polarity and
magnitude of high voltage surges on power lines caused by lightning
strikes. These early measurements were critical for the development of
reliable electrical power transmission and distribution
systems. Lichtenberg figures are still used as a forensic clue for
identifying
the cause of injury or death of human and animal lightning victims.
Recent studies of Lichtenberg figures and charge detrapping in polymers
are revealing
important details on the mechanisms that are involved in the
degradation and electrical breakdown of solid insulating materials.
There may even be future medical applications as well. In 2009, a team
of researchers at Texas A&M University proposed using
3D Lichtenberg figures created within various polymeric materials as
"templates" for growing blood vessels (vascular tissue). There are
significant similarities between branching Lichtenberg figures
and animal circulatory systems - a fact not lost on many
medical researchers. The hope is that, by creating branching 3D
Lichtenberg figures inside a biodegradable polymer, such as polylactic acid (PLA), scientists can then use these as "molds" to support the development and growth of vascular tissue.
Vascularization
is essential for growing functional replacement tissues and organs. It's possible that the 18th century technology
of Lichtenberg figures may ultimately play a role in organ replacement therapy almost 240 years later!
Captured Lightning sculptures are "fossilized lightning bolts" Captured
Lightning is an accurate description for our sculptures, and holding a
Captured Lightning sculpture is about the closest you can come to
holding a fossilized lightning bolt.
Each Lichtenberg figure is unique - a one-of-a
kind treasure, sculpted in exquisite detail by the same electrical forces unleashed by natural lightning. Captured Lightning sculptures are completely
safe - they are completely discharged and are not radioactive.
Two-dimensional photos cannot begin to capture the beauty and exquisite
detail of 3D Captured Lightning
sculptures. Following are a pair of 3D images that can be rotated 360
degrees so that you can more fully appreciate the detail within some of
some doubly-irradiated sculptures. Once the images have been completely
downloaded, you can drag your mouse over the image to rotate each for a
full 360 degree view.
3D Rotatable Image
3D Rotatable Image
"Heavy Weather"
(Courtesy of Theodore Gray)
"Windblown Lightning" (Courtesy of Theodore Gray)
Very few people have actually seen or held one of these rare objects of
scientific art. Far fewer have had the
opportunity to own sculptures as beautiful and spectacular as these.
Stoneridge Engineering LLC is proud to be the world's most experienced
provider of these rare treasures.
Can I make my own Lichtenberg Figures? A. Fractal wood-burning (carbonized Lichtenberg figures): Unfortunately, since electrons must be injected deep into the acrylic,
it takes a
multi-million-volt electron accelerator to make 3D
Captured Lightning sculptures. Even my patient, understanding spouse
won't let me install one of these at home.
However, 2D Lichtenberg
figures can be
made by creating carbonized paths on the surfaces of some materials, such as wood or cardboard, or as "dust figures" on the
surfaces of some
plastics. Some artists have used this technique, sometimes called "fractal wood burning", to make 2D works of art. Please
note that fractal wood burning must be done VERY carefully since it
involves using dangerously high voltages and water together. We do NOT endorse fractal wood burning since it can KILL you.
Because it is so dangerous in inexperienced hands, the American
Association of Woodturners (AAW) has banned using this technique.
The process requires using a high voltage (HV) source, such as a neon sign transformer (NST) or microwave oven transformer (MOT). Because the output current is limited, an NST
or a solid state HV supply is much safer than using a MOT as a HV source.We strongly recommend that you DO NOT use a MOT, since these innocent looking HV transformers easily have enough power to kill you as it carbonizes
parts of your body. The high current "freezes" your muscles, preventing
you from letting go. It also prevents you from breathing or even
screaming for help. You get NO do-overs or second chances with a MOT,
and electrocution will be
agonizingly painful during your last few minutes.
The experiment should be done outside since the burning material
generates a large quantity of smoke, sparks, and small flames. You should always have a
helper present to warn you of possibly dangerous situations and who can shut off
power if you can't. Two nails or straight pins are
driven
into the wood with a gap of 4 - 12 inches.
The surface is then lightly sprayed or brushed (with HV power OFF!)
with a saltwater or baking soda solution to make it
partially conductive, and the high voltage source is connected to the
two nails. Once high voltage is applied to the nails, carbonized
paths begin to form near the nails. Accompanied by LOTS of smoke, they
begin branching as they grow towards each other.
The heat from the process dries out the nearby surface, causing the
branches to continuously change direction, sometimes even heading away from the opposite nail. The carbonized paths eventually grow to form Lichtenberg figures with "roots" at each
nail. A method to adjust the output voltage (such as a variable
autotransformer) also helps to control the discharge process and
improves
the
shape of the resulting figure. Finally, a pair of widely separated
normally-open (NO) push buttons should be connected in series and also
in series with the input power to your HV source. This safety measure
requires that both buttons be pressed (one by your right hand, the other
by your left) in order to power up the HV source. This insures that you
won't make manual contact with the HV and it will automatically turn
off power if one or the other hands are removed.
NEVER touch
the HV wires, nails, alligator clips, or wood when high voltage is
present. Any carelessness can be FATAL. As of mid-2023 over FORTY-FIVE people have
been accidentally electrocuted by MOT power sources! Do NOT attempt to make wood Lichtenberg figures if you do not have
previous experience in working with high voltage electricity or are
tired or otherwise impaired. And never mix alcohol and high voltage work.
The following video clip shows this
technique being used with a safer 9,000 volt 30 mA NST as the high
voltage source:
B. Acrylic Fractal Dendrites:
Following is a link to another way to make colorful patterns that look
similar to Lichtenberg figures. The resulting Fractal Dendrites are
created using low-cost acrylic paints and isopropyl alcohol. The
colorful results are beautiful and safe to make. Be sure to check out
the tutorial and video at acrylgiessen.com.
More fun with electrons: Glowing rocks, flashing crystals, going to the dark side, and "Rad-Cams 1 and 2"
High-energy electrons and x-rays can cause many other fascinating effects within crystalline solids. One particularly interesting phenomenon is called thermoluminescence. In thermoluminescent materials, high-energy electromagnetic radiation,
such
as x-rays, may be absorbed by atoms in the crystal, causing them
to rise to a higher, semi-stable energy level. When these excited atoms fall back to their normal state, they radiate electromagnetic energy, sometimes within the visible light spectrum.
Thermoluminescent materials are usually triggered into releasing their stored
energy by applying heat. Sensitive light detectors, such as photomultipliers,
are used to detect the faint light emitted by most specimens. The light
output versus temperature is called a glow curve and its shape tells
much about the nature of the material and its cumulative radiation
history.
The emitted radiation is often in the infrared (IR) or ultraviolet
(UV) portion of the electromagnetic spectrum, and thus not directly
visible. Although many thermoluminescent materials require the
application
of relatively high temperatures to release their thermoluminescence,
some minerals radiate visible light at room temperature. One outstanding
example is the mineral Calcite
(CaCO3), which may glow brilliantly after being irradiated by a
powerful electron beam or X-rays. However, the thermoluminescent glow is not from the
calcite itself, but from traces of impurity elements such
as manganese embedded within the crystalline structure of the calcite. Manganese is one of many known activators,
and is responsible for the characteristic yellow-orange glow seen in
many calcite specimens. Other common thermoluminescent activators include lead, copper, cobalt, magnesium, iron, nickel, and silver. Very clear calcite (called "Iceland Spar)
typically shows relatively little visible thermoluminescence since the purer crystals
contain fewer activator atoms.
The degree of luminescence is proportional to the amount of cumulative
radiation seen by the specimen. Passing a
manganese-activated calcite crystal through a high-energy electron beam several
times will cause the specimen to glow brightly for many hours at room
temperature. Although the glow curve for electron-irradiated calcite
peaks at about 110 degrees Celsius, significant light is emitted at
room temperature. The amount of light rapidly decreases as
the temperature of the calcite is lowered, and virtually disappears below 0
degrees Celsius. So, if we irradiate a frozen specimen
of calcite, its thermoluminescent properties will not be immediately obvious. However,
if we keep it cold and then warm it up to room
temperature some time later, it will then glow brightly. The
following image shows Dr. Timothy Koeth admiring a spectacular
glowing calcite crystal brought by Dr. David Speck during our 2010 Lichtenberg run.
Common table salt (NaCl) is also thermoluminescent. However, unlike calcite, it doesn't
glow at room temperature. When irradiated with high-energy electrons,
NaCl changes to a cinnamon color due to the trapping of electrons in defects in the crystal structure. Called F-Centers, these are vacancies inside the crystalline lattice
of the salt crystals. Irradiated salt will remain this color as
long as it is kept cool, dry, and protected from UV light. When
the irradiated salt crystals are dropped onto a hotplate, each crystal
emits a bright flash of green light as it reverts back to its normal
clear/white
color. The phenomenon and the associated physics can be seen in this video clip from The Action Lab.
When dropped into distilled water, the cinnamon color also
disappears. However, the dissolving salt emits a faint bluish-green glow (called aquoluminescence)
as previously-trapped electrons liberate their energy.
After exposure to light, irradiated salt changes from cinnamon to a
dark blueish-purple color. This is thought to be caused by
trapped F-center electrons as they combine with positively-charged sodium ions inside the crystal matrix. This reduces them to
atoms of metallic sodium inside the crystalline matrix. The resulting colloidal
dispersion of atomic sodium throughout the crystal causes the dramatic
color
change. When dissolved in distilled water, the purple color also
disappears. While supplies last, we can provide small amounts of
cinnimon-colored irradiated salt ("Flashing Crystals") to interested
amateur experimenters and instructors for the cost of shipping. Contact us to request.
Another interesting phenomenon occurs within irradiated potassium chloride (KCl). This material is
normally a white crystalline solid. However, when subjected to high-energy
electrons or X-radiation, it changes to a dark purple color. Applying
heat or UV (sunlight) turns it back to its normal white color. This behavior is relatively rare phenomenon - KCl is a "scotophor". Unlike a phosphor, which emits light when excited by ionizing radiation, a scotophor darkens when irradiated. This process is called reversible photochromism or tenebrescence.
Other example of includes photochromic eyeglass lenses that darken from UV in sunlight, and then bleach back to normal
transparency in lower light. KCl was used in some early radar cathode ray tube (CRT)
displays since it could be quickly "written" by an electron beam,
creating an image with very
long persistence. The recorded image could then be erased by applying a
bit of heat to the material. Very few minerals exhibit reversible
photochromism - these include hackmanite, scapolite and tugtupite.
The following image shows KCl and NaCl that have changed from being
white powders (before irradiation) to dark purple and cinnamon-colored
crystals after irradiation by multiple passes through a 5 MeV electron
beam.
During an experimental run in June 2013, Andrew Seltzman, a guest and
graduate-level physics student from the University of Wisconsin, built a
protective "cave" for his Sony Cyber-Shot DSC-P72 3.2 MP camera
using sheet lead topped with a one inch thick piece of high-density polyethylene (HDPE) to reduce production of X-rays. Andrew mounted his camera
inside the cave and positioned it so that it could record a "cart's-eye
view" of various objects being irradiated
with the 3 to 5 million volt electron beam. We were thinking that the
first pass through the beam might be a one-way trip, since the scattered
electron and radiation levels were so intense. We were amazed to
discover that the "Rad-Cam" not only survived, it faithfully recorded
its journey through the beam - not just once, but for a dozen trips! The
only obvious problem was that the microphone seemed to become less
sensitive after every pass. However, the camera fully recovered a few days after the run.
During our Fall 2014 production run, Andrew designed a much more
sophisticated radiation camera setup that used a HD GoPro Hero 3+ camera
inside a 1/4" thick lead "cave". The camera "looked" through a one-inch
thick leaded glass window. The new design provided significantly better
radiation protection than the 2013 camera setup. You can see details of
Andrew's RadCam 2 camera setup and some resulting photos and video clips captured during our 2014 run. These include a video clip
with the camera looking upward (via a 45 degree stainless steel mirror)
at the blue glow of electrical corona created by the high-energy
electron beam as it passes though eighteen inches of air! A similar video clip
also looks up at the beam through a 6" x 6" x 3/4" PMMA specimen. As it
passes through the beam, it self-discharges. The brilliant glow from
the specimen occurs as high-energy electrons crash into PMMA molecules,
and the width of the scanning electron beam can also be estimated
(approximately three inches). We suspect that the brilliant glow from
the PMMA specimen is a combination of Cherenkov radiation and cathodoluminescence. Finally, small spark-like flashes from secondary discharges can be seen after the main discharge.
The following video clip (using the earlier RadCam 1 setup from the 2013
run) shows boxes of various minerals, and a large calcite crystal
becoming energized by ionizing radiation
from the beam. The crystal fluoresces a brilliant yellow-orange color
while being irradiated, then continues to softly glow, looking like a
hot coal. However, it remains cold to the touch. The acrylic sphere in
front of the
calcite fluoresces an intense blue-white as the electron beam hits it,
then briefly flashes when it self-discharges. Speckles in the
image and static in the audio are caused by high-energy electrons and
x-rays impacting the camera's image sensor and audio
electronics.
The loud buzzing sound is from high-energy x-rays directly interfering
with the camera's electronics as the beam is scanned across the width of the
cart 100 times each second. The Sony Cyber-Shot's video and audio
systems finally
become overwhelmed as the camera passes directly under the electron
beam. Although the radiation and ozone
levels in the room would be lethal to living organisms, this tough
little camera just shook off the abuse and came back for more!
High Beam and Glowing Air - RadCam3
During our 2015 production run, Andrew Seltzman
brought a 3rd generation radiation-resistant HD camera. The GoPro Hero
3+ was housed within a 1/2" thick lead box with a leaded glass window.
Since previous
tests showed that this system could tolerate very high energy electrons
and x-radiation, we decided to run the camera through the beam with it
set to maximum power (~150 kW). We also turned off the lights so
that we could capture the glowing air under the accelerator's output
window. As
relativistic electrons collide with nitrogen molecules, they transfer
some energy to the molecules, exciting them into higher rotational and
vibrational states. When the excited molecules fall back to their normal
state, they radiate energy at various frequencies (called spectral
lines).
Nitrogen's predominant spectral peak is in the near ultraviolet (337 nm
or UV-A region), with
17 other peaks
spanning 280 nm through 430 nm. The visible blue light is from lower
frequency
(400 - 430 nm) nitrogen lines, but most of the radiated light actually
lies within the UV portion of the EM spectrum. In the video clip, the
orange glow of the calcite
specimens in the foreground intensifies just before they pass under the
electron beam. We suspect that this is from increased X-radiation
as the specimens approach the beam. Speckling is from high-energy X-rays
that have passed through, or have been created within, the lead shield
and then struck the image sensor at various
angles. Videos of other experiments done during our 2015 production run
can be seen on Andrew's web site.
Frame grab from above video clip showing glow from fluorescing nitrogen molecules
Another
frame grab as the cart gets closer to the electron beam.
The calcite
crystals in the foreground glow brilliantly from increasing X-radiation.
How can you get a Captured Lightning sculpture of your very own?
We offer a wide selection of Captured Lightning sculptures that range in size from
affordable 2-inch specimens through museum-quality two-inch thick blocks as large as 15 by 20 inches. Please visit Gallery 1 or Gallery 2
to select a sculpture in the right price range for you. We also offer a wide
variety of lighted bases with white, blue, and multi-color
color changing options. In addition to US power, many of these are also available with UK,
Australian, or EC power options. Our light bases illuminate the delicate
patterns within, causing the discharge channels to glow so that even
the finest hair-like details become visible. We also offer a variety of
attractively-priced experimental sculptures discounted from 10-40% off regular price. Also, be sure to visit our Eye Candy
page to see some of the best artistic and experimental work by
Stoneridge Engineering LLC and some of our very creative friends.
A
physical experiment which makes a bang is always worth more than a
quiet one. Therefore a man cannot strongly enough ask of Heaven: if it
wants to let him discover something, may it be something that makes a
bang. It will resound into eternity.
Lichtenberg, Georg Christoph, and Albert Leitzmann. 1906. "Georg Christoph LichtenbergsAphorismen: nach den Handschriften.
Drittes Heft, 1775-1779," page 326. Originally in German, from Lichtenberg's Booklet F, Aphorism 1138, Oct 11-13, 1778.
(Thanks to Fermilab scientist and author, Bill Higgins for researching the source of the above quote!)
"Thunder is good; thunder is impressive. But it is the lightning that does the work." - Mark Twain
References and Further Reading:
1. Gross, Bernard, "Irradiation Effects in Plexiglas", Journal of Polymer Science, Volume 27, 1958, Issue 115, Pages 135 - 143
2. Hashishes. Yuzo, "Two Hundred Years of Lichtenberg Figures", Journal
of Electrostatics, Volume 6, Issue 1 , February 1979, Pages 1-13
3. Chadwick, K. H., "The Effect of Light Exposure on the Optical Density
of Irradiated Clear Polymethylmethacrylate", 1972 Phys. Med.
Biol. 17, Pages 88-93
4. Chadwick, K. H., and Leenhouts, H. P., "Fading of radiation-induced
optical density in polymethylmethacrylate on oxygen diffusion", Phys.
Med. Biol. 15 No 4 (October, 1970), Pages 743-744
5. L. Niemeyer, L. Pietronero*, and H. J. Wiesmann, "Fractal Dimension
of Dielectric Breakdown", Phys. Rev. Lett. 52, Pages 1033 1036 (1984)
6. Gardner, Donald G., et. al., "Radiation-induced changes in the index
of refraction, density, and dielectric constant of
poly(methylmethacrylate)", Journal of Applied Polymer Science, Volume
11, Issue
7,July 1967, Pages 1065-1068
7.Akishin, A.A.; Tseplyaev, L.I., "Edge effect in radiation-charge
dielectric materials", Physics and Chemistry of Materials Treatment, v
31, n 1, Jan.-Feb. 1997, p 30-1. A similar paper is also contained
within the book "Effects of Space Conditions on Materials", Akishin, A.
I., Nova Science Publishers, 2001, ISBN 978-1590330289
8. Fothergill, J.C.; Dissado, L.A.; Sweeney, P.J.J., "A
discharge-avalanche theory for the propagation of electrical trees. A
physical basis for their voltage dependence", Dielectrics and Electrical
Insulation, IEEE Transactions on, Volume 1, Issue 3 , June 1994, Pages 474 - 486
9. R. A. Galloway, T. F. Lisanti and M. R. Cleland, "A new 5 MeV 300
kW Dynamitron for radiation processing", Radiation Physics and
Chemistry, Volume 71, Issues 1-2, September-October 2004, Pages 551-553
10. Sessler, G.M.. "Charge distribution and transport in polymers", IEEE
Transactions on Dielectrics and Electrical Insulation, Volume 4, Issue 5, Oct. 1997, Pages 614 - 628
11. Karczmarczuk, Jerzy, "Dendrites in Nature and in Computer", Foton 84/SPECIAL ISSUE, Spring 2006
12.
C. M. Foust, "Instruments for Lightning
Measurements (Includes Klydonograph and Lichtenberg Figures)", PDF, General Electric Review, Volume 34,
#4, April, 1931, Pages 235 - 246
13. Watson, Alan and Dow, Julian, "Emission Processes Accompanying
Megavolt Electron Irradiation of Dielectrics", Journal of Applied
Physics, December 1968, Volume 39, Issue 13, pages 5935-5940 14. Fujimori, S., "Fractal properties of breakdowns", Properties and
Applications of Dielectric Materials, 1988. Proceedings, Second
International Conference on Properties and Applications of, 12-16 Sept.
1988, Volume 2, Pages 519 - 522
15. Domart, Yves, M. D., Garet, Emmanuel, M.D., "Lichtenberg Figures Due
to a Lightning Strike", New England Journal of Medicine, Volume
343:1536, November 23, 2000, Number 21, Images in Clinical Medicine
16. H. Hiraoka, "Radiation Chemistry of Poly(methacrylates)", Radiation Chemistry, March 1977, pages 121-130
17. Brown, R. G., "Time and Temperature Dependence of Irradiation Effects in Solid Dielectrics", Journal of Applied Physics,
September 1967, Volume 38, Issue 10, pages 3904 - 3907
18. Yu. S. Deev, M. S. Kruglyi, V. K. Lyapidevskii and V. I.
Serenkov,"Mechanism underlying the formation of dendritic or tree-like
channels in a dielectric irradiated with charged particles", Atomic Energy,
Volume 29, Number 4, October, 1970, pages 1037-1040
19. Ebert, Ute and Arrayas, Manuel, "Pattern Formation in Electric Discharges", PDF, p. 270 -
282 "Coherent Structures in Complex Systems", eds.: D. Reguera et al.,, Lecture Notes in Physics" 567 (Springer, Berlin 2001)
20. Yu.N.
Vershinin, S.V. Barakhvostov, "Electron Processes in the Pulse
Breakdown of Solid Dielectrics", PDF, 3rd International Conference on
Technical and Physical Problems in Power Engineering , (TPE-2006), May
29-31, 2006 - Gazi University, Ankara, Turkey (covers detonation theory of high field breakdown in solid dielectrics) 21.
Vershinin, Yu. N., "Parameters of Electronic Detonation in Solid
Dielectrics", Technical Physics, Vol. 47, No. 12, 2002, pages 1524 1528.
Translated from Zhurnal Tekhnichesko Fiziki, Vol. 72, No. 12, 2002,
pp.39 43, ISSN: 10637842
22. Budenstein, P.P., "Dielectric Breakdown in Solids", PDF, Technical Report, US Army Missile Command, October 16, 1975, DTIC accession #ADA018550
23. Budenstein, P. P., "Toward Developing a Dynamic Theory of Electric
Breakdown in Solids", Conduction and Breakdown in Solid Dielectrics,
Proceedings of the 3rd International Conference on, Publication Date:
3-6 July 1989, pages 522-527.
24. C. M. Cooke, E. R. Williams and K. A. Wright, "Space Charge
Stimulated Growth of Electrical Trees", Proc. Intl Conf on Properties
and Applications of Dielectric Materials, Xian, China, 1985, Pages 1-6
25. C. M. Cooke, "Space-Charge-Induced Breakdown in Dielectrics",
Contract: Grant AFOSR-84-0107 for the Air Force Office of Scientific
Research, June 1, 1984 to September 30, 1985, by MIT Laboratory for
Electromagnetic and Electronic Systems High Voltage Research, DTIC
Accession #ADA176969
26. C. M Cooke, E. R. Williams, K. A. Wright, "Electrical Discharge
Propagation in Space-Charged PMMA", IEEE International Symposium on
Electrical Insulation, Philadelphia, PA, 1982, pages 95-101
27. N. I. Kuskova, "Spark Discharges in Condensed Media", Technical Physics, Volume 46, Number 2, 2001, pages 182-185
28. Theodore Gray, "Theo Gray's Mad Science: Experiments You Can Do At Home - But Probably Shouldn't", Black Dog & Leventhal Publishers, 2009, ISBN 978-1579127916 29. Jen-Huang Huang, Jeongyun Kim, et al, "Rapid Fabrication of
Bio-inspired 3D Microfluidic Vascular Networks", Journal of Advanced Materials, Vol 21,Issue 35, pages 1-5, DOI: 10.1002/adma.200900584
30. Bejan, Adrian and Zane, J. Peder, "Design in Nature: How the
Constructal Law Governs Evolution in Biology, Physics, Technology, and
Social Organization", Doubleday Publishing, 2012, ISBN 978-0385534611
31. R. G ler Yildirim, V. Emir Kafadar, et al, "The Analysis of
Thermoluminescent Glow Peaks of Natural Calcite after Beta
Irradiation", Radiation Protection Dosimetry (2012) doi:
10.1093/rpd/ncs020.
32. Claudio Furetta, "Handbook of Thermoluminescence", World Scientific, 2010, ISBN 978-9812838919
33. Health Physics Society Science Support Committee, "Irradiated Salt Demo", PDF
34. Don Lancaster, "Thermoluminescence: Theory and Applications", PDF
35. Dr. George R. Rossman, "Colors in Gems: The New Technologies", PDF, Gems and Gemology, Summer 1981
36. P. Uhlig, J. C. Maan, P. Wyder, "Spatial Evolution of Filamentary
Surface Discharges in High Magnetic Fields", Physical Review Letters, Volume 63, Number 18, October 30, 1968
37. Payrebrune, Mark A. and J. Blain, McGill University, Montreal, QC,
Canada, 1979, Appendix A of Master of Science Thesis, "Experimental Morphology of
Lichtenberg Figures". Appendix A is an English translation of G. C.
Lichtenberg's 1778 paper, "NOVA METHODO NATVRAM AC MOTVM FLVIDI
ELECTRICI INVESTIGANDI" which was originally published in Latin.
38. American Physical Society Buzz Blog, "Captured Lightning: Electrons Follow Fractals Through Insulators", August 18, 2016
39. Fractal Foundation - Learn all about fractals. A fascinating museum and web site for children and adults alike.
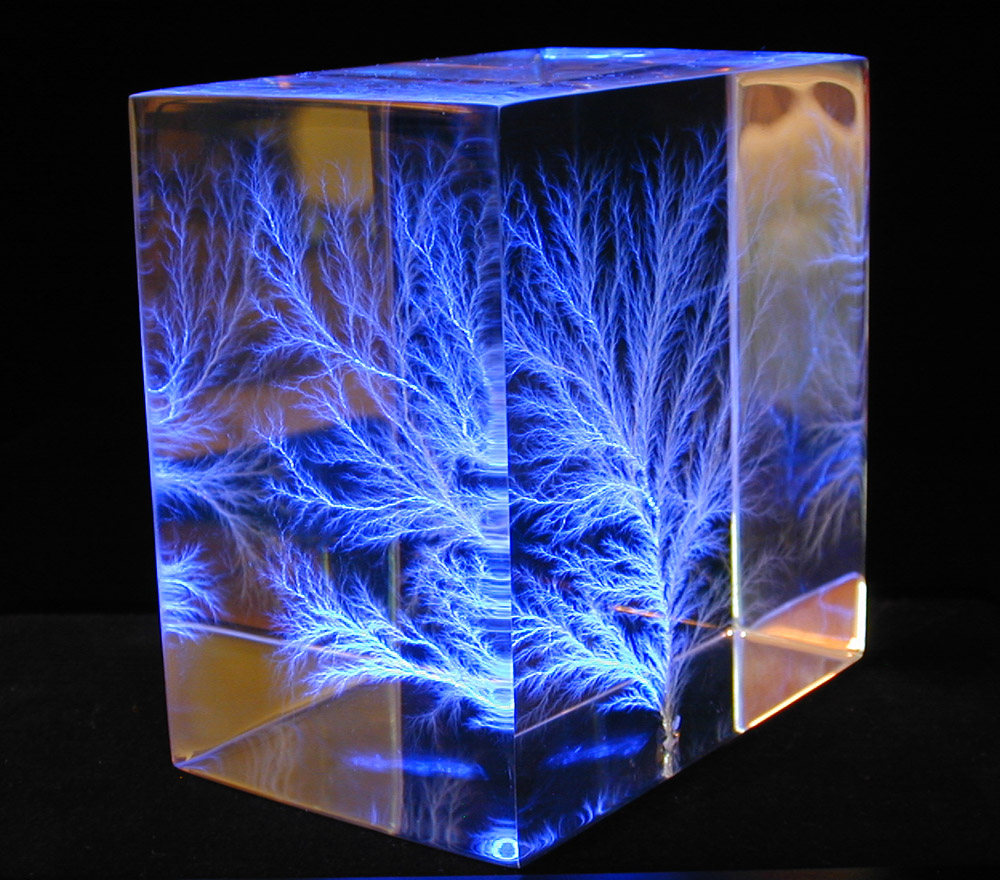
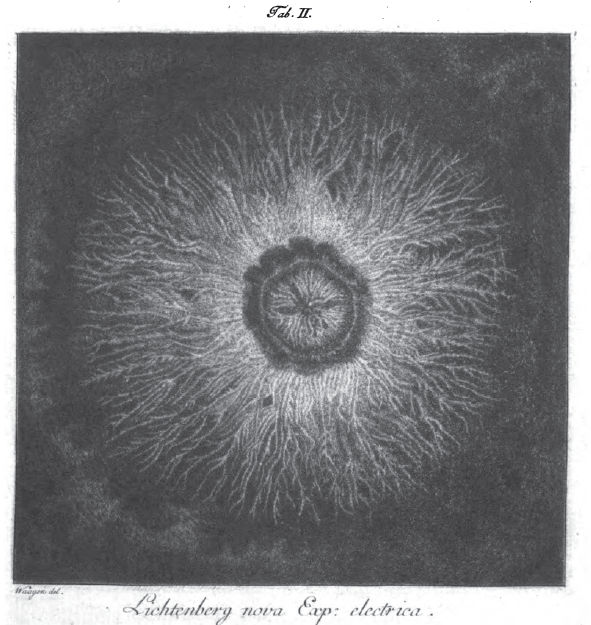
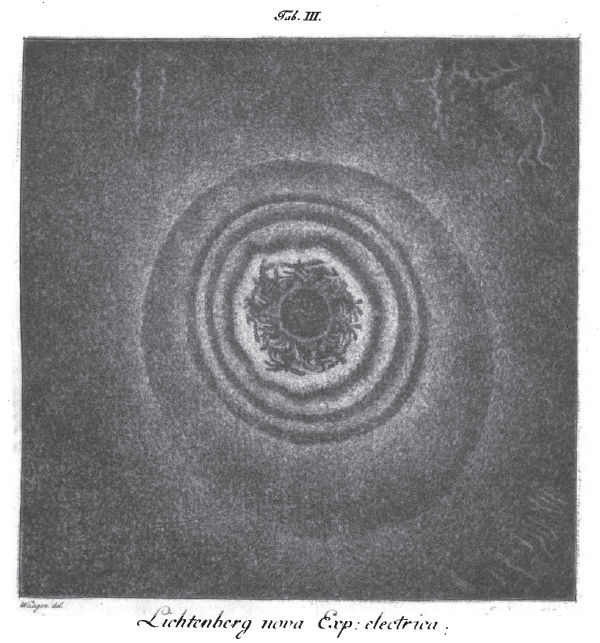
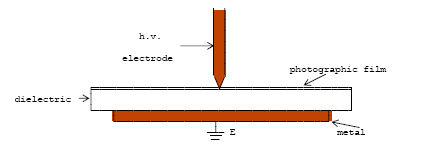
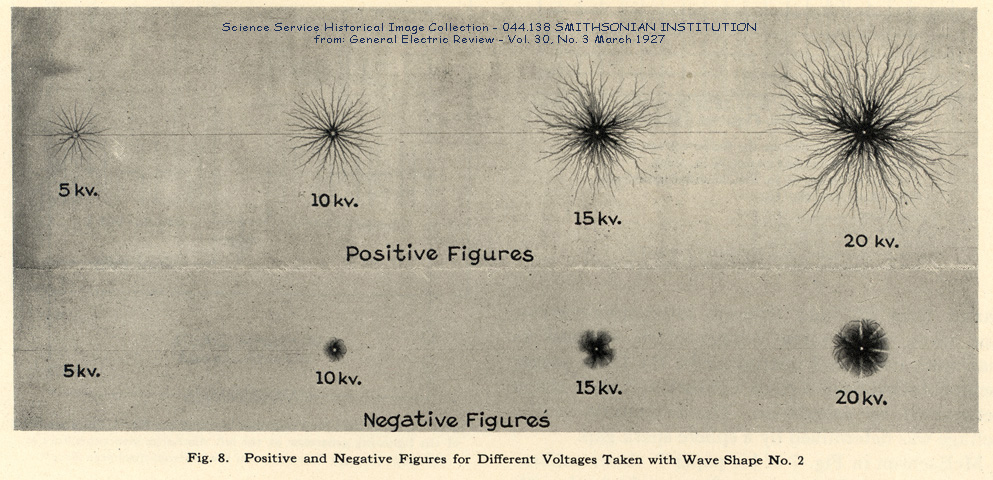
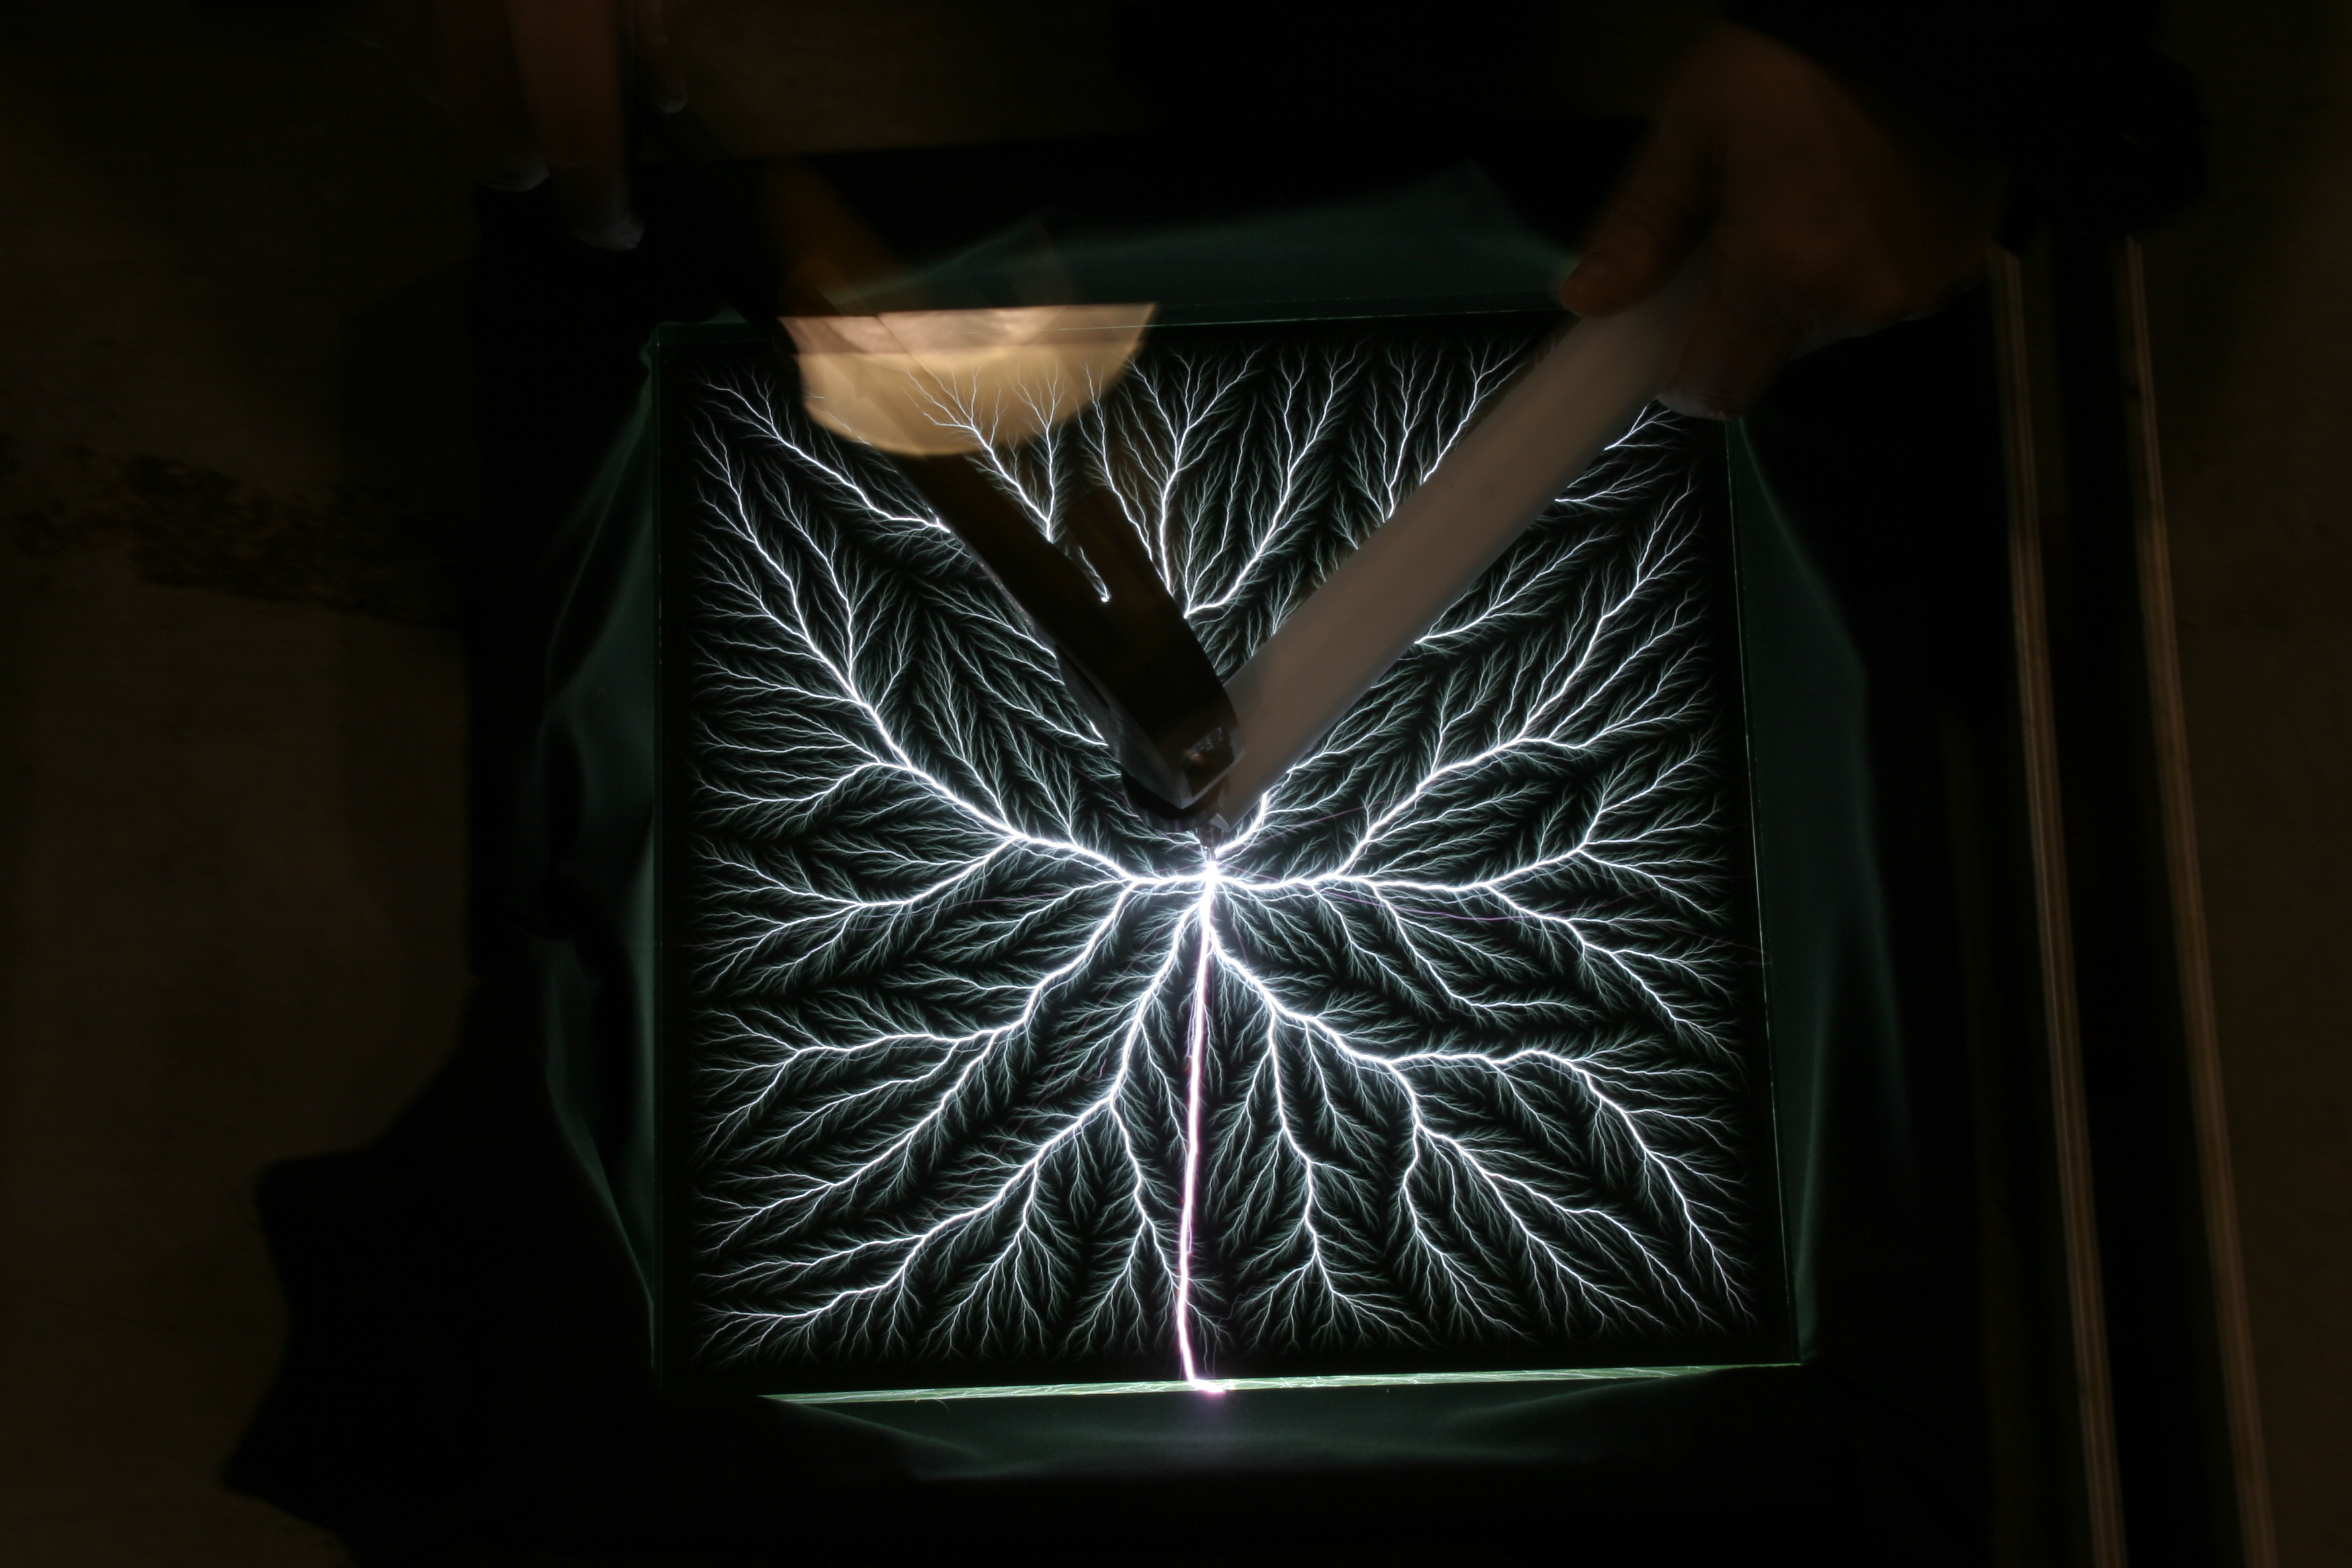
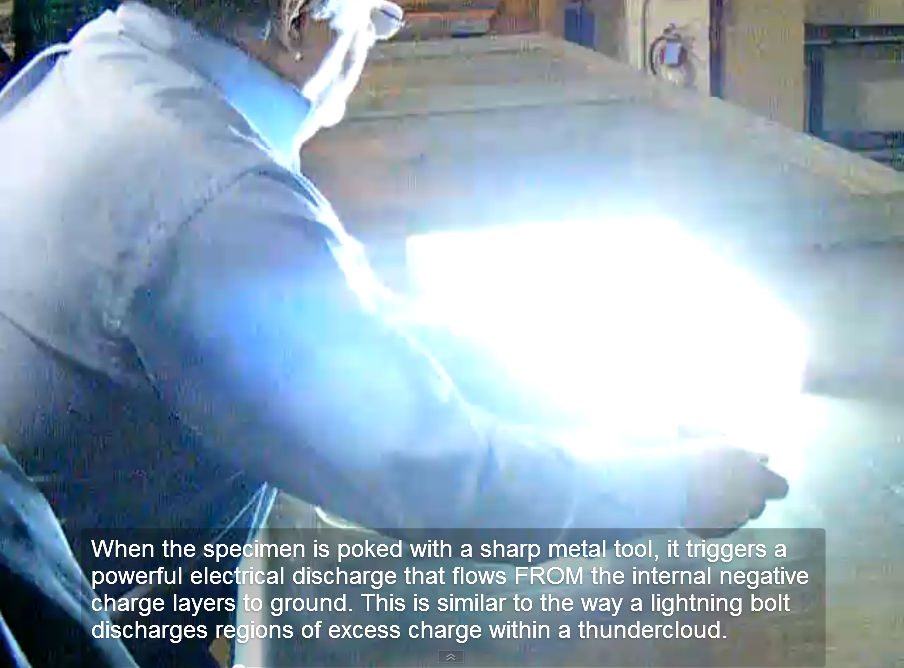
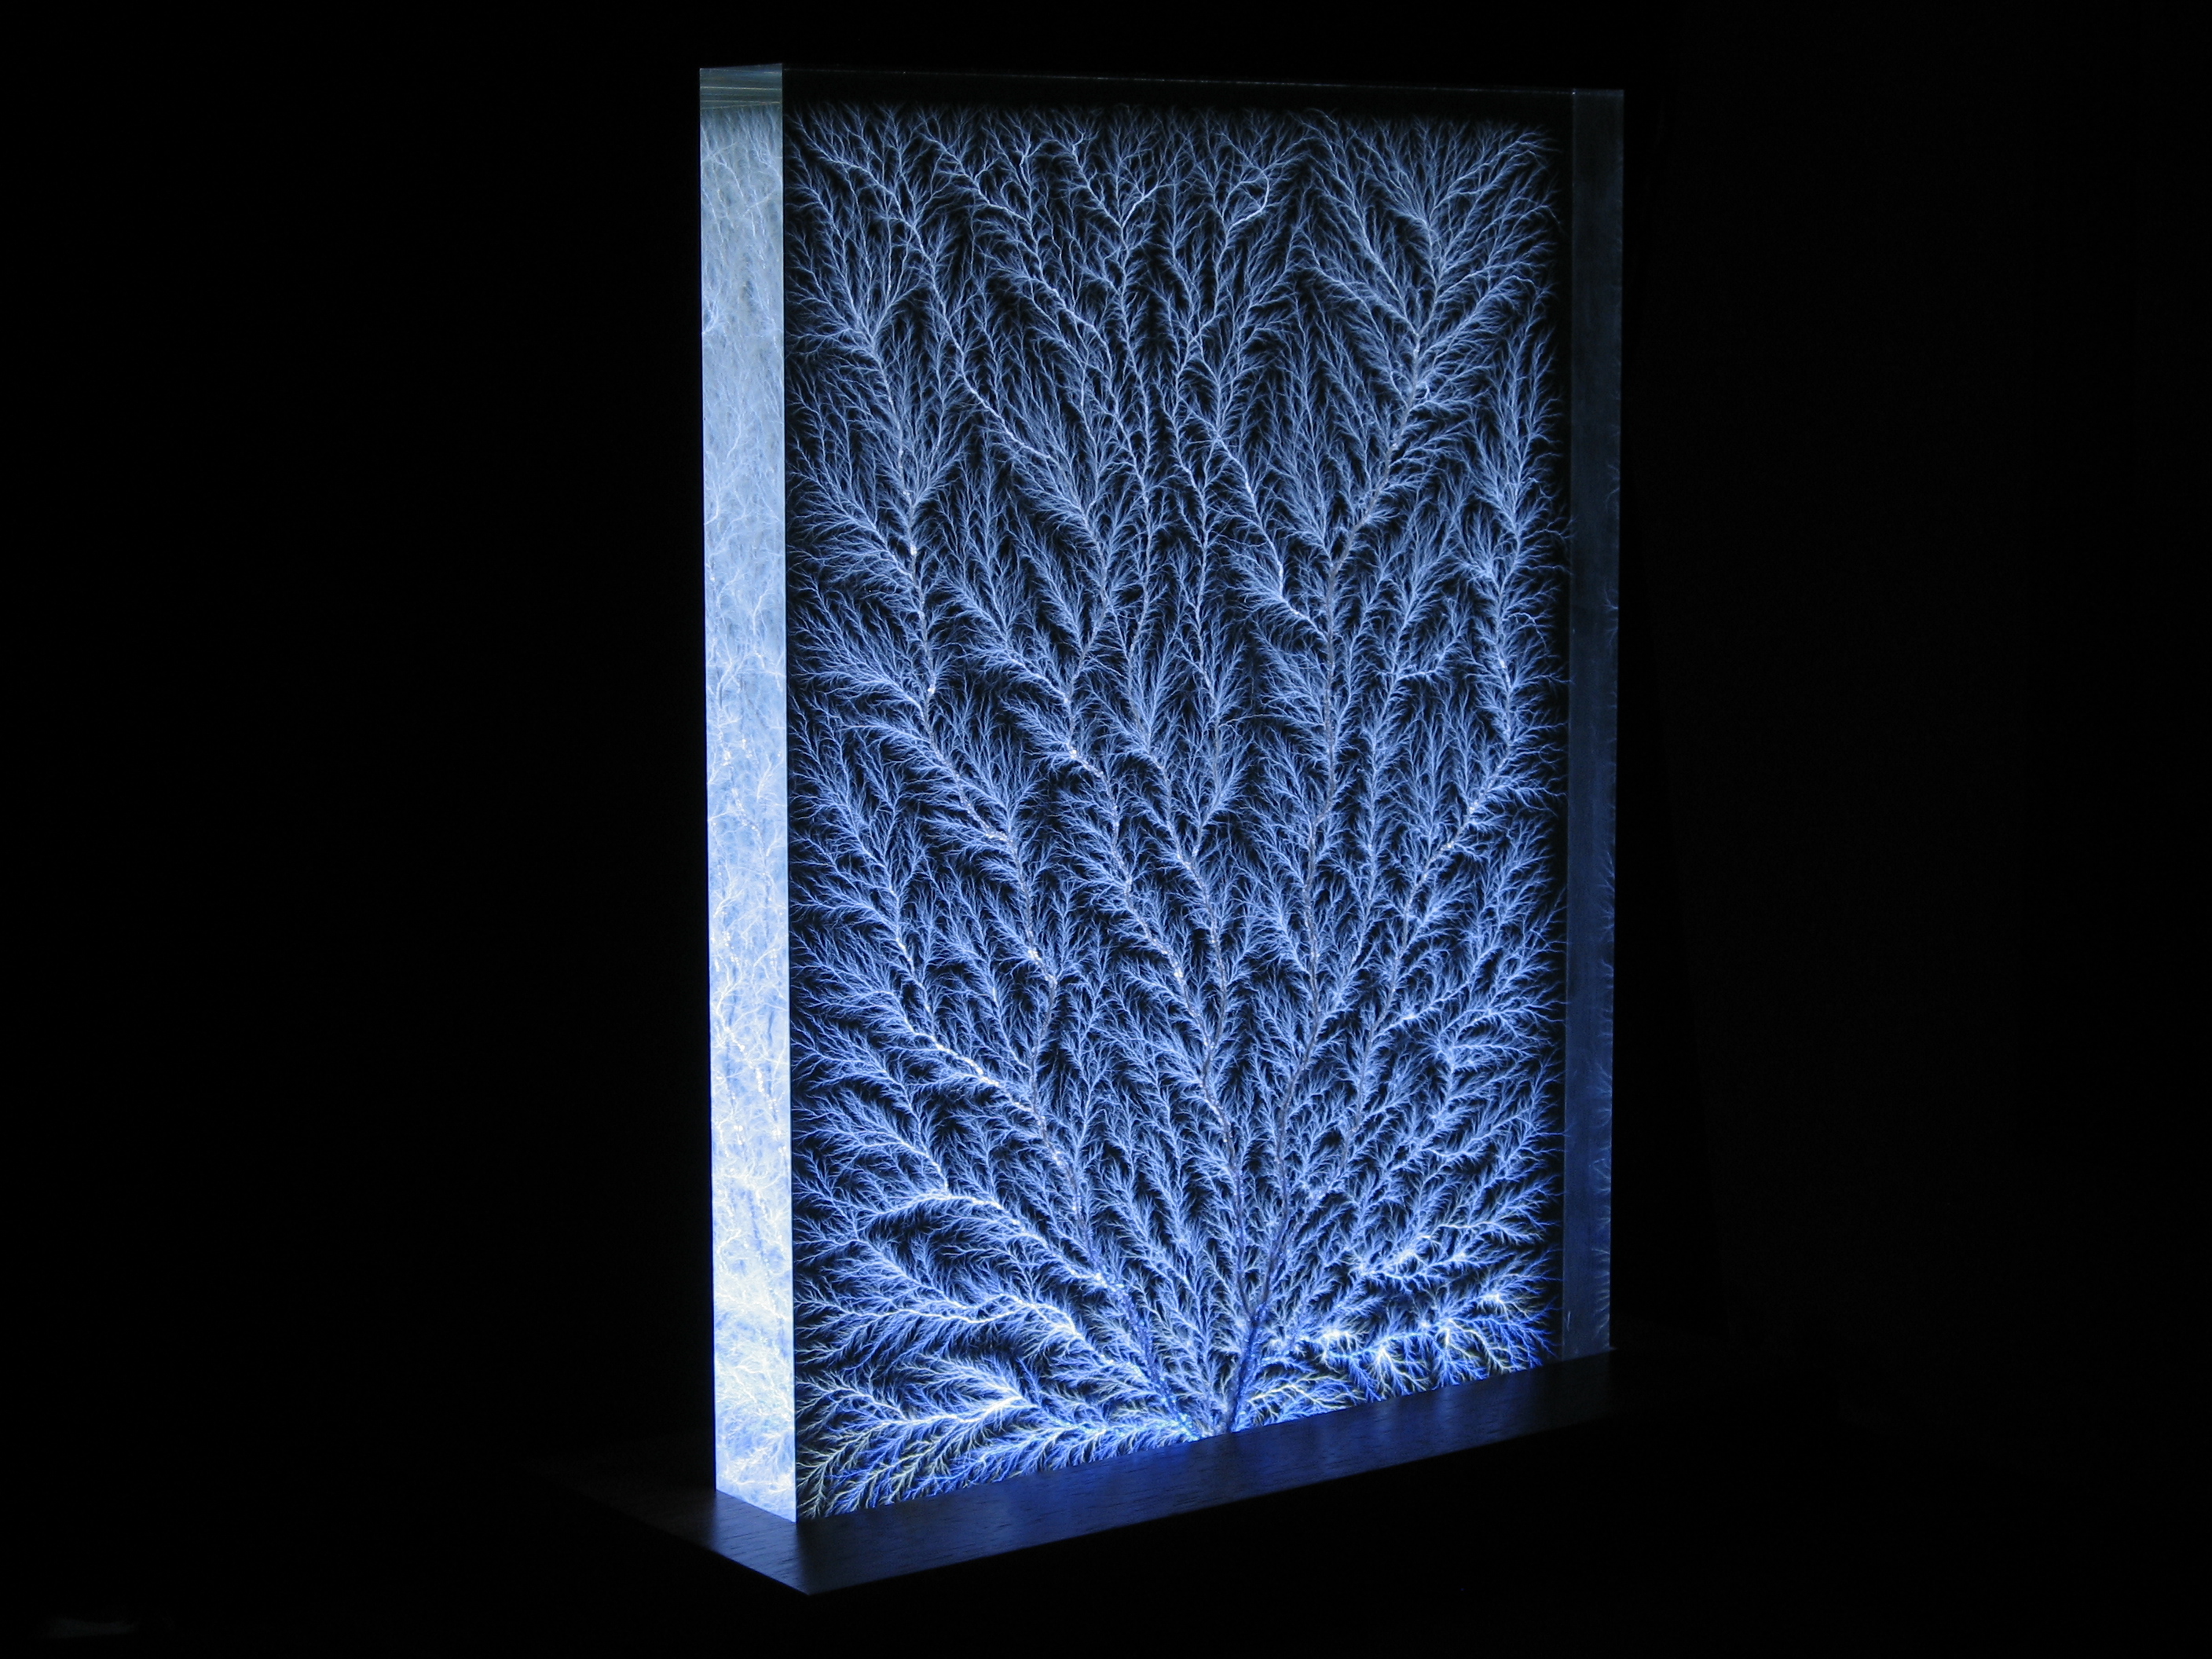


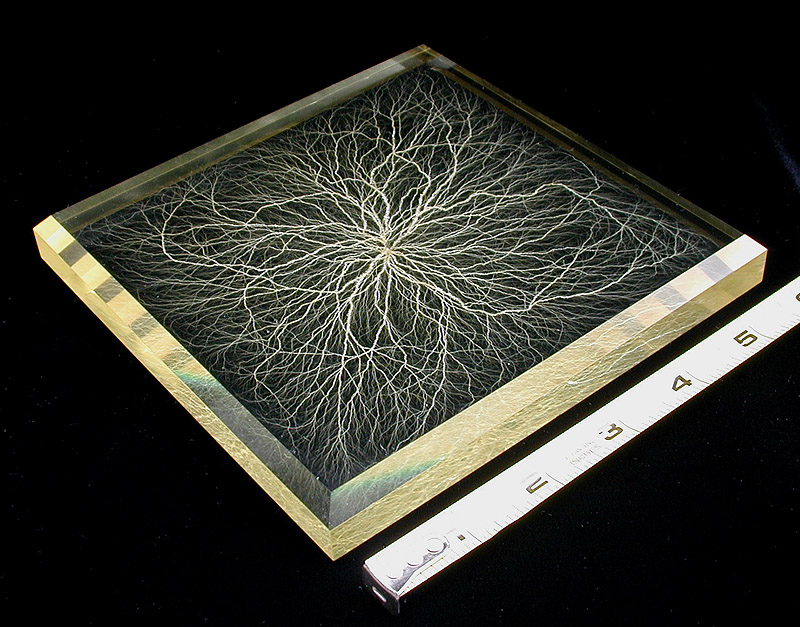
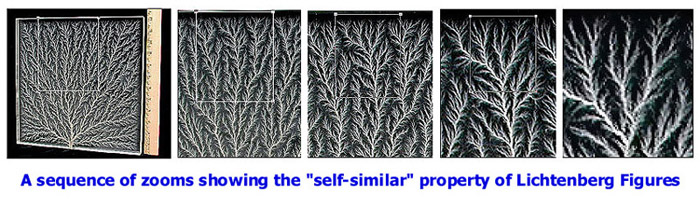
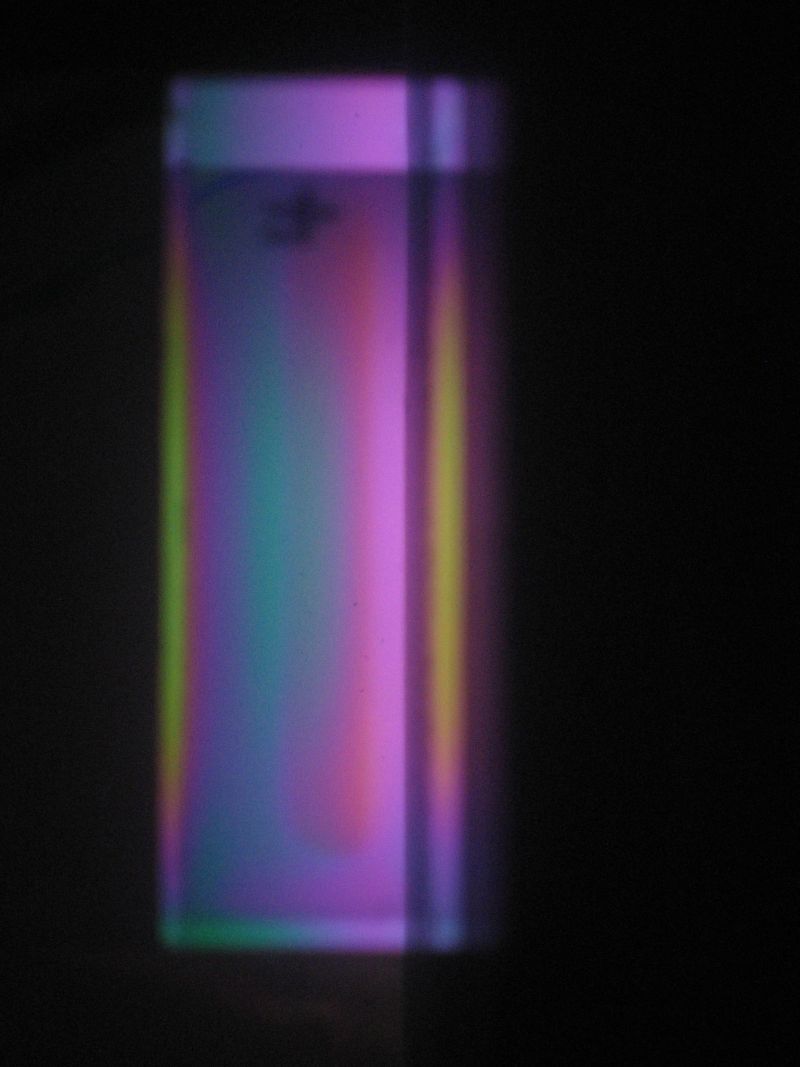
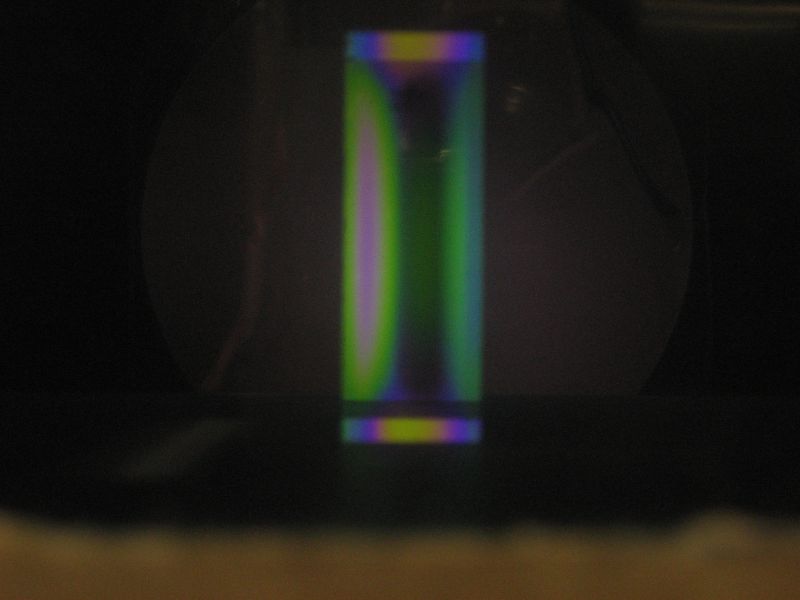
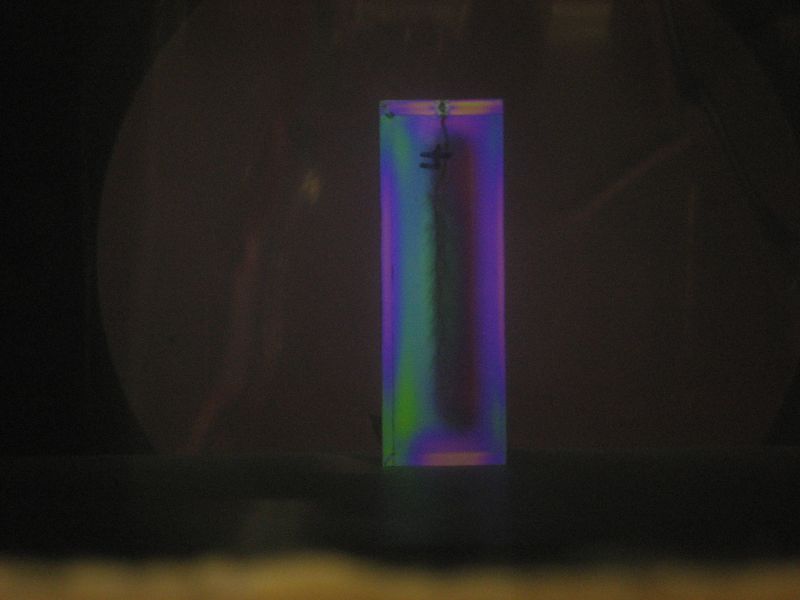

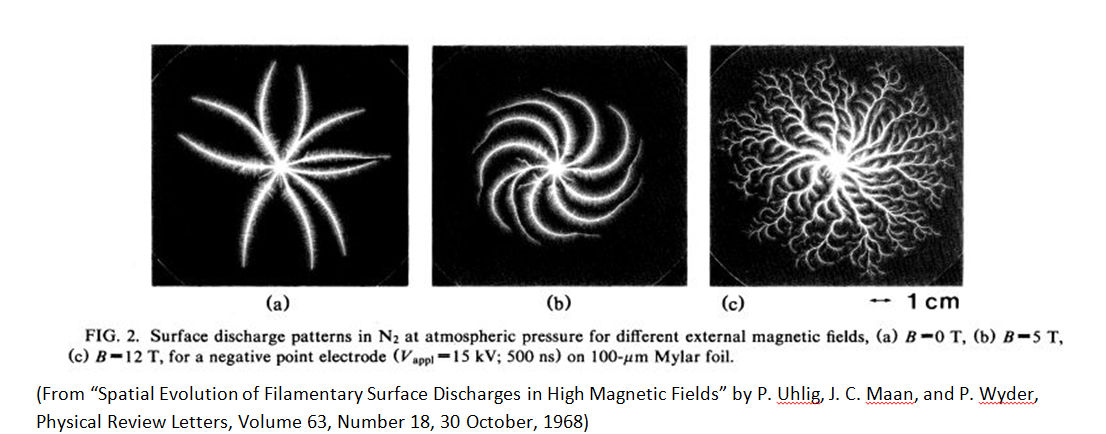
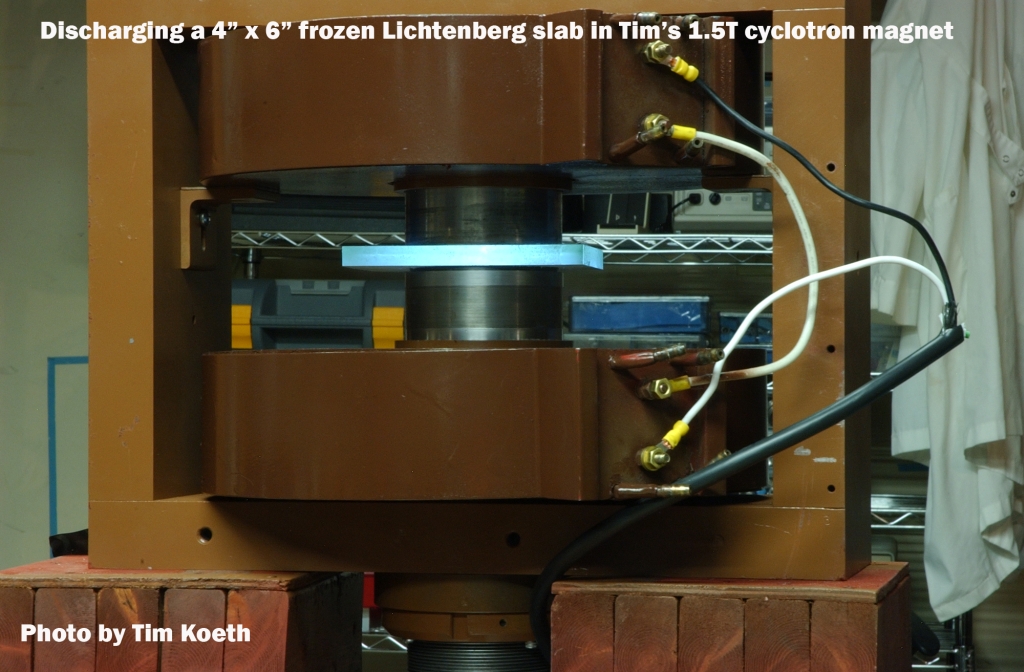
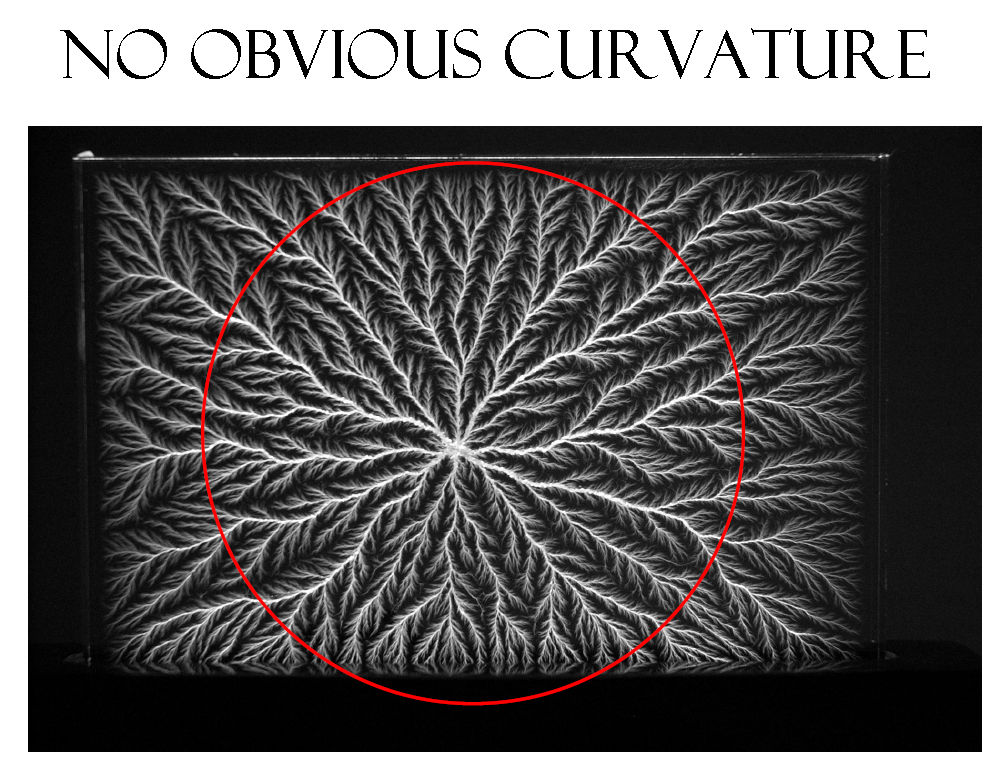
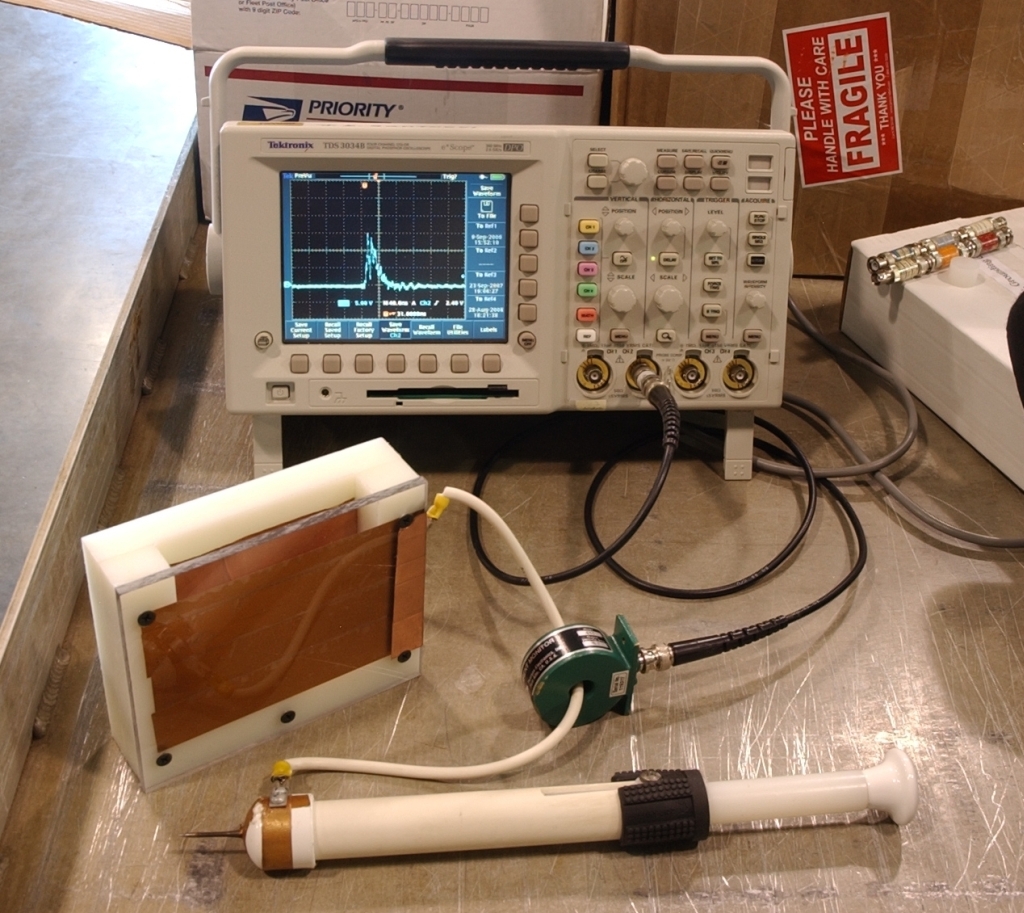
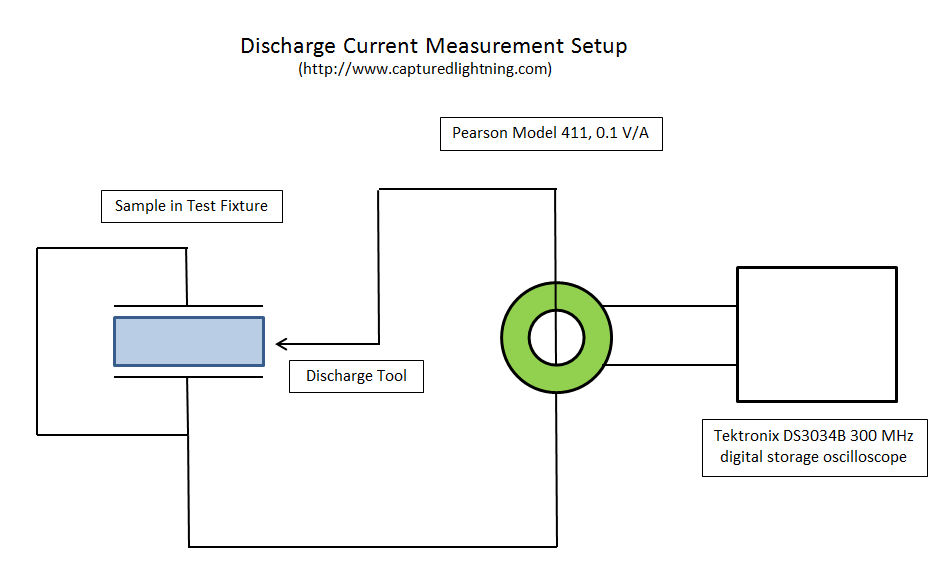
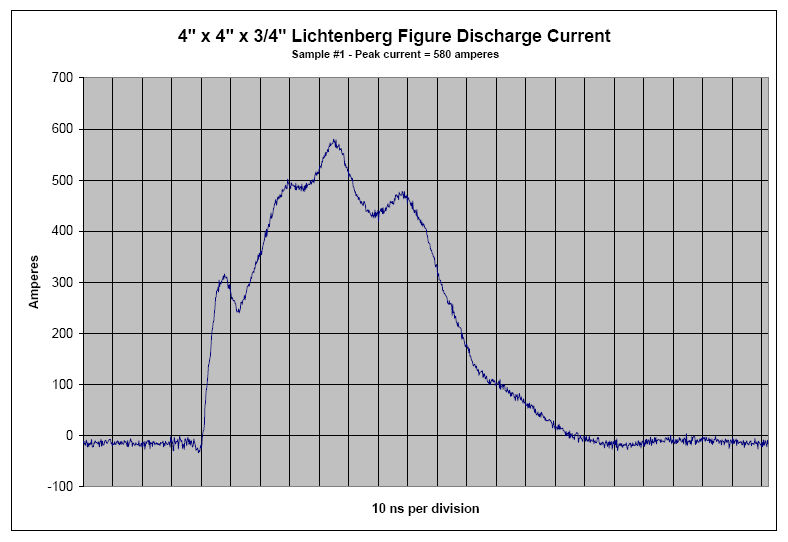
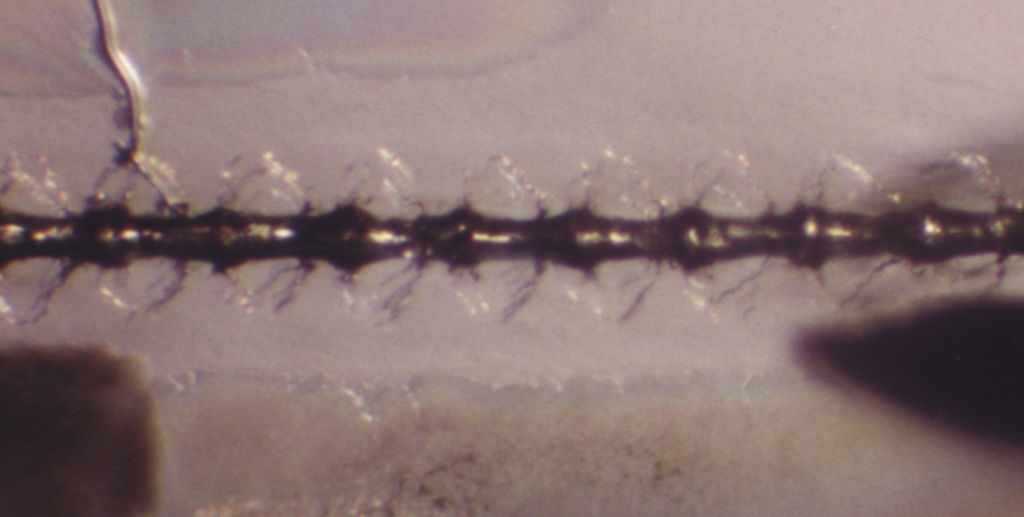
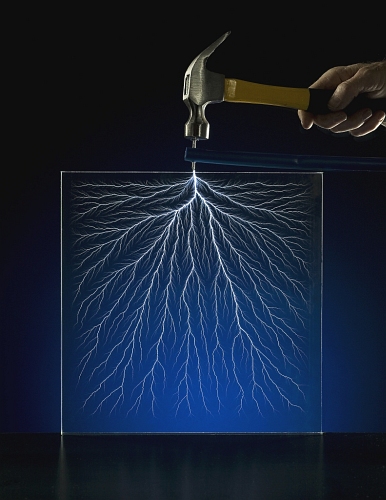
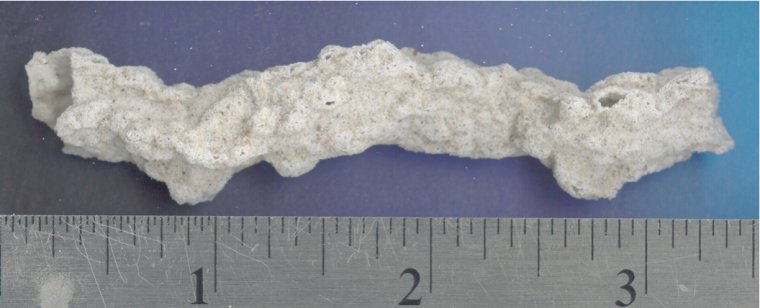
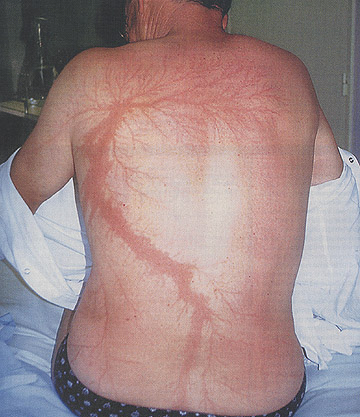
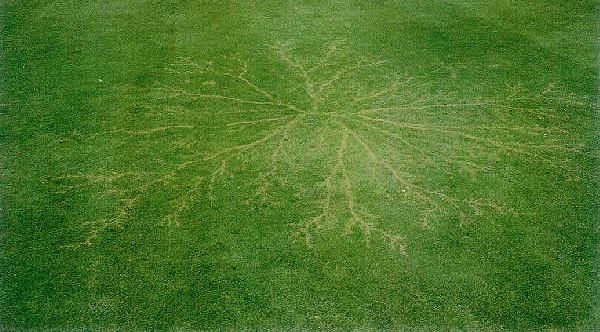
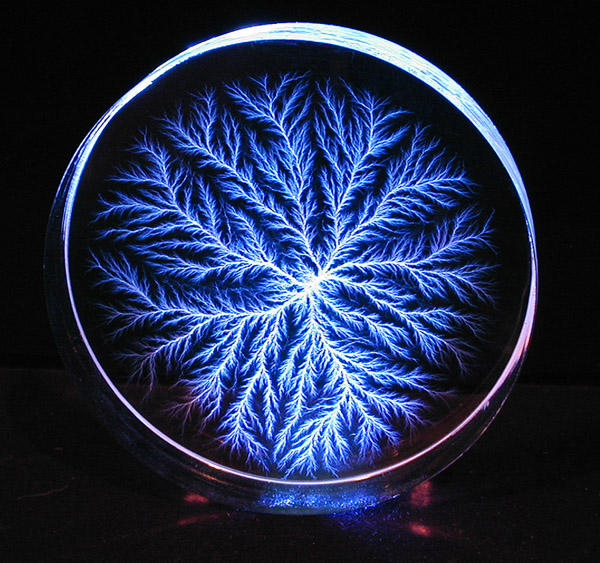
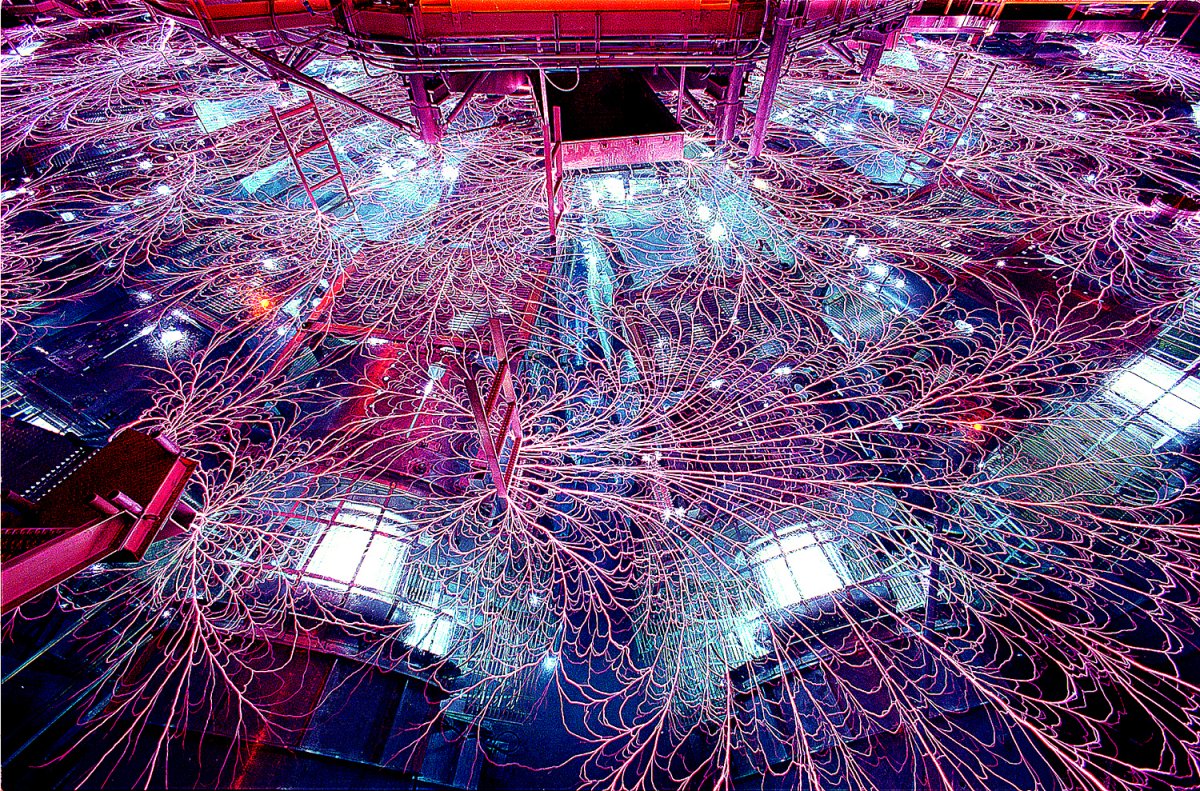
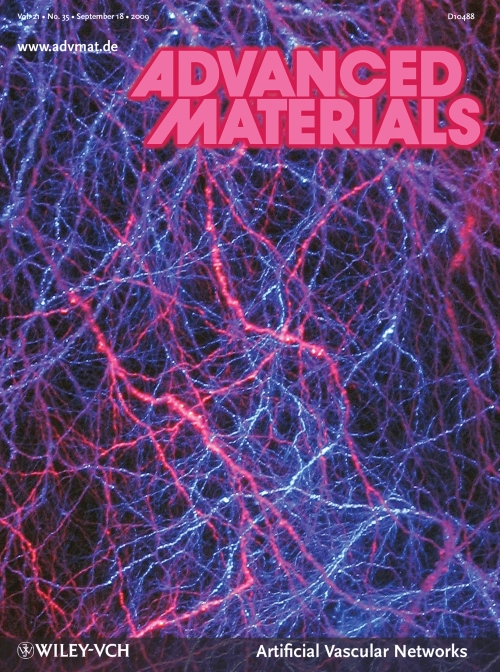
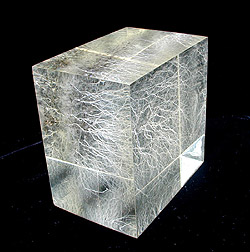
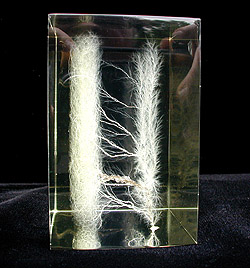
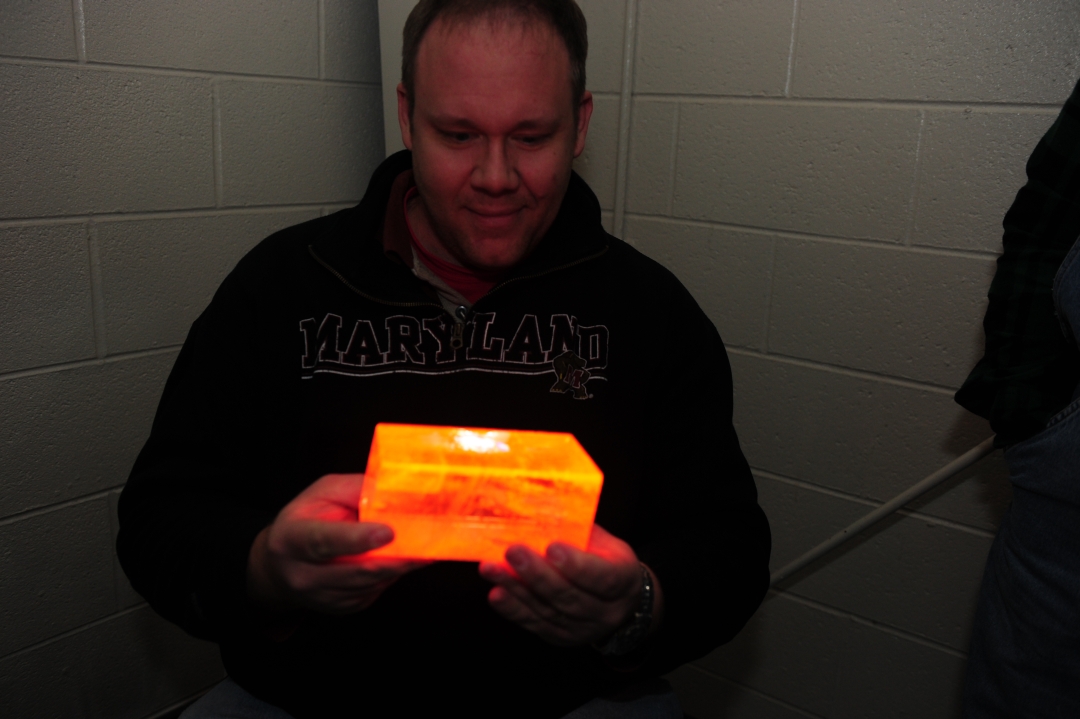
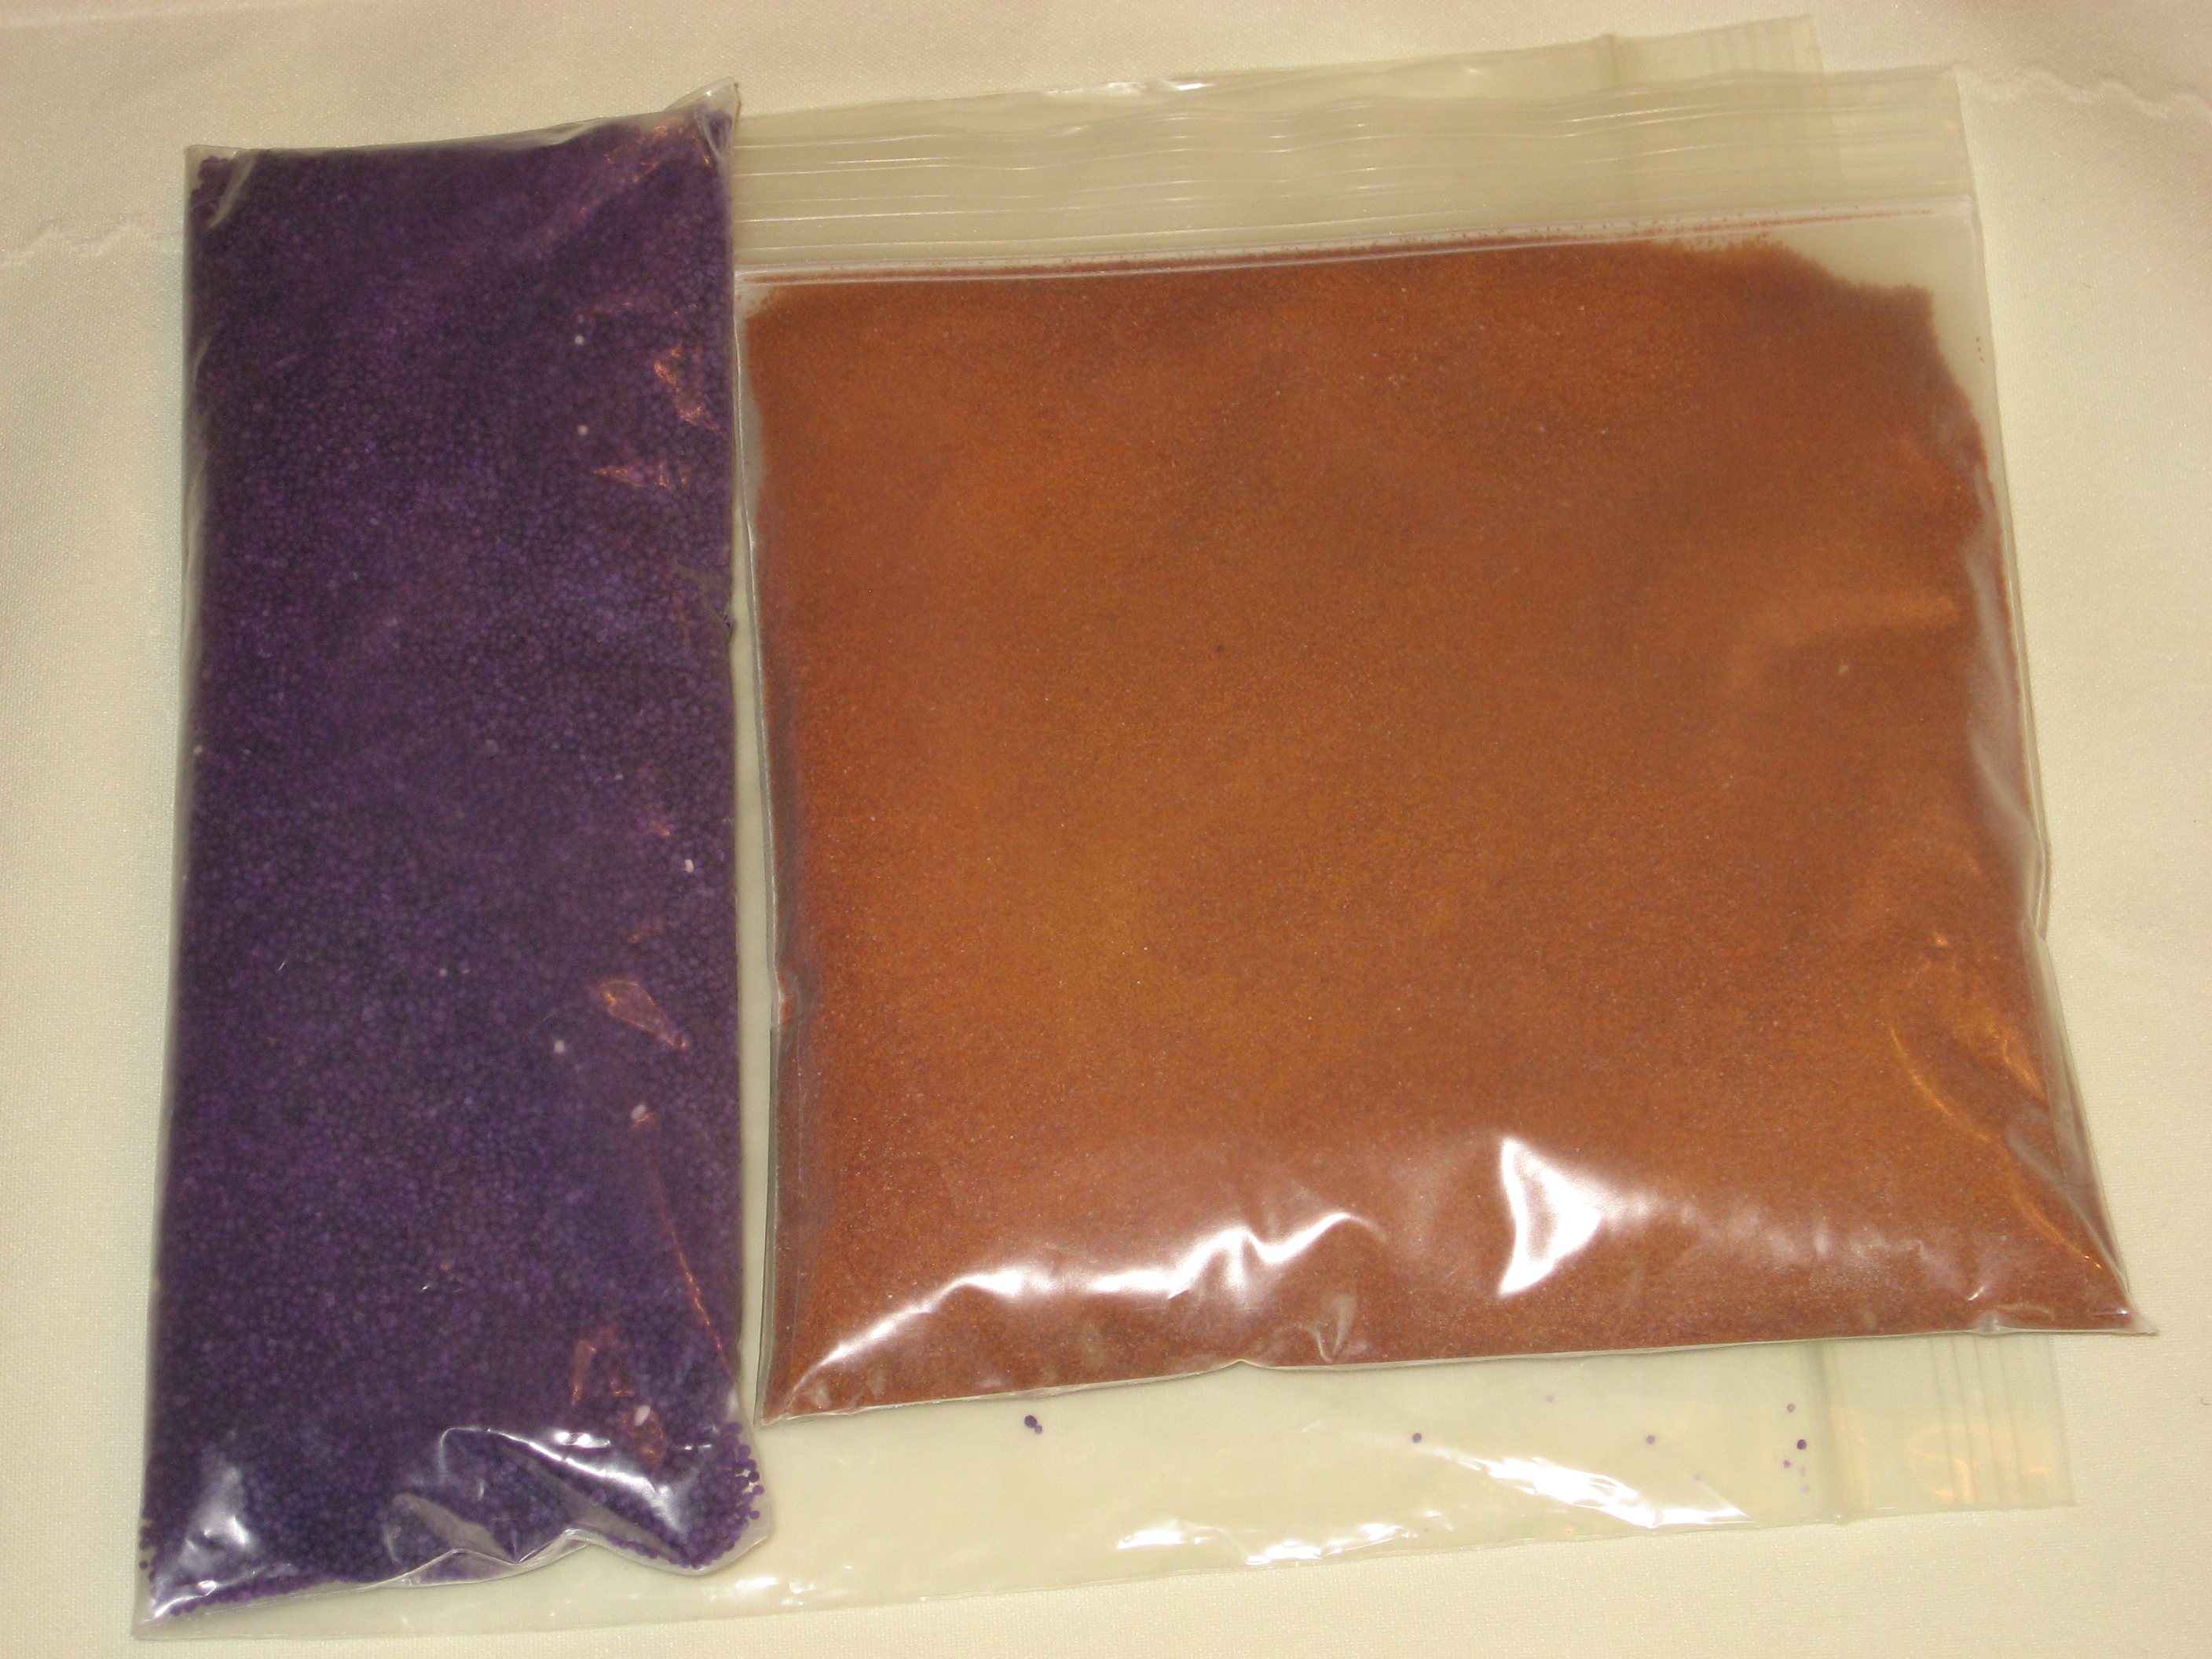
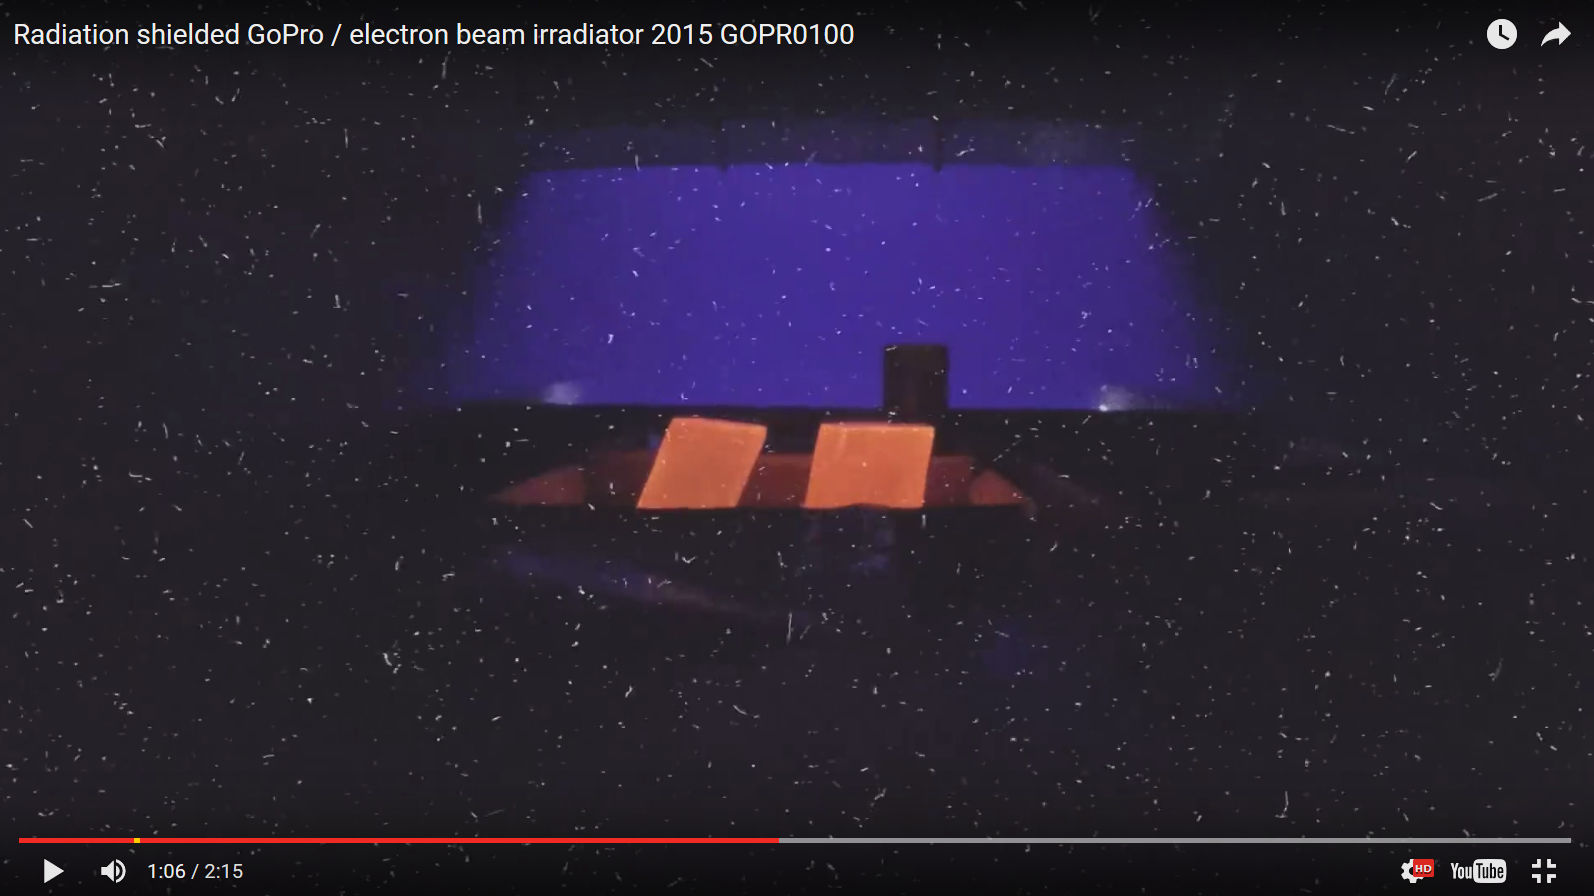

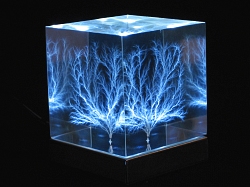
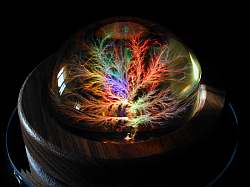
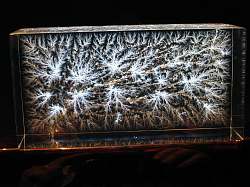
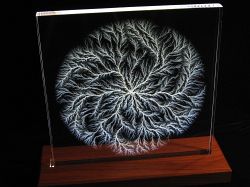


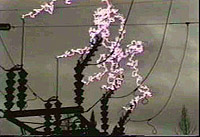


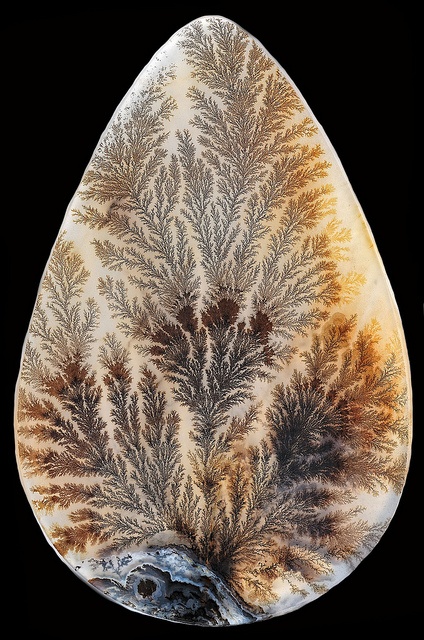